how have Super El Niño years impacted ski season in the past?
The short answer: Super El Niño does not guarantee a big ski season in any region I studied. It guarantees a wild card, in most cases.
The talk around town is the same: "Super El Niño is coming, it's going to dump" or “Vote for Super El Niño." Truthfully, as a skier, we look for any reason to hope for a killer ski season but what did previous extreme El Nino years look like and can they give us any clues as to what this upcoming winter will look like?
NOAA's Climate Prediction Center now gives this winter a 75% chance of being the strongest El Niño since records began in 1950. The ENSO phase greatly impacts weather patterns in the United States (and Eastern Asia for that matter). But the strength of this upcoming El Nino is unprecedented and will likely lead to weather unlike anything we’ve seen previously. The ENSO phase influences the success of a fishing season, the presence or absence of rain for crops, and snowpack in the Western United States.
The question skiers ask is simple: what does it mean for snow this winter?
So I went back to the last four Super El Niño winters and checked what they delivered in the four regions from my ENSO series: the Washington Cascades, Northern Utah's Wasatch, Lake Tahoe, and Colorado's San Juan Mountains. Same stations, same method, 37 winters of data.
How big is this one?
Only four winters since 1950 have crossed the "Super" line, and this one is forecast to blow past all of them.
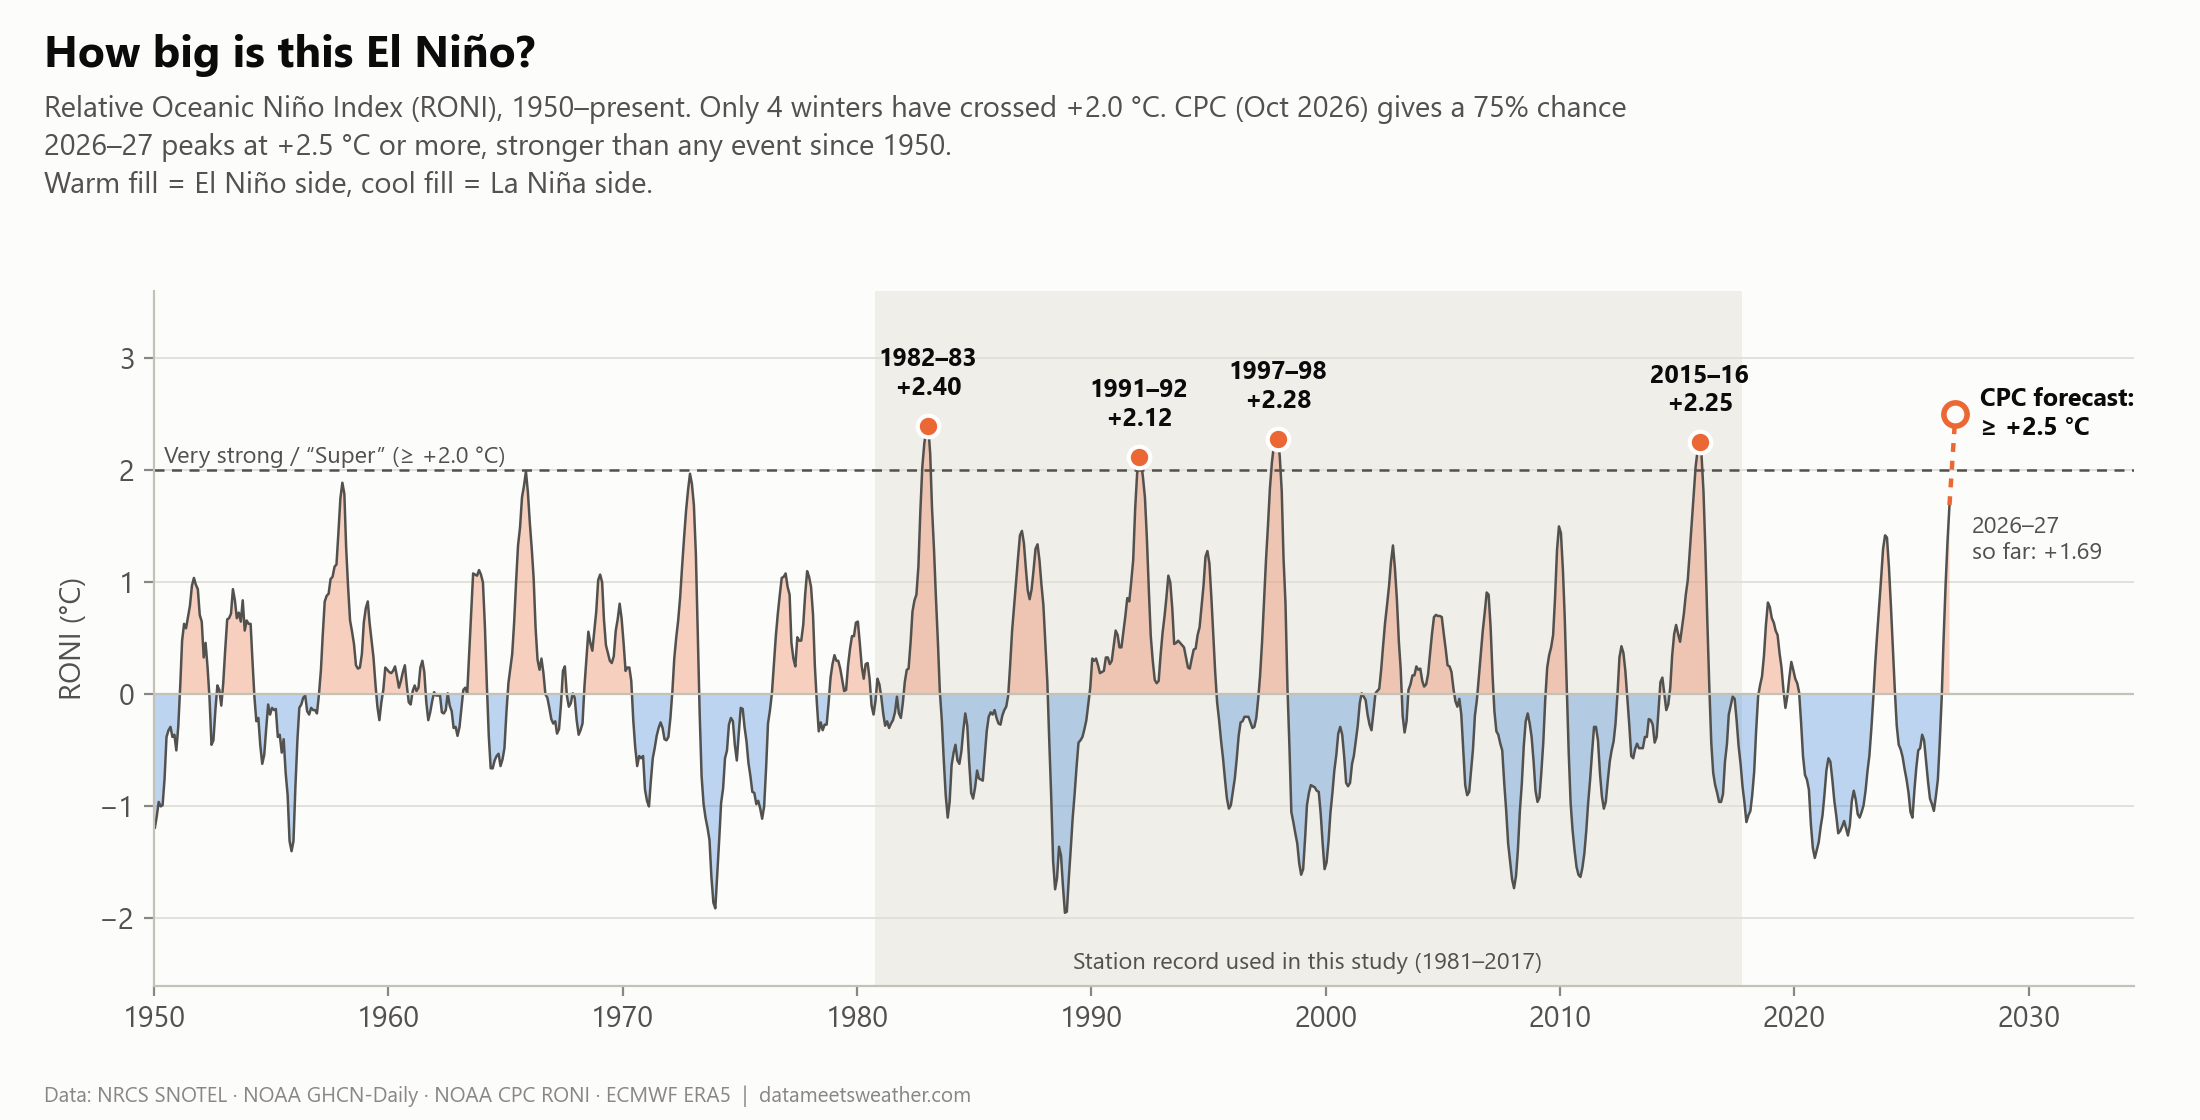
El Niño is measured by how warm the tropical Pacific Ocean runs compared to normal. I'm using NOAA's newer Relative Oceanic Niño Index (RONI), which accounts for the fact that the tropics have warmed in general. Think of it as grading curve— just because the climate is warmer doesn’t mean indexes are inflated.
By this definition, four winters crossed +2.0 °C:
1982–83: +2.40 °C
1991–92: +2.12 °C
1997–98: +2.28 °C
2015–16: +2.25 °C
Switching to RONI (instead of ONI) changes the years of interest. 1991–92 gets promoted to Super, and 2023–24 (+1.42) gets demoted. Through September, 2026–27 was already at +1.69 °C, and CPC expects it to peak at +2.5 °C or more.
What did the last four deliver?
Inconsistency— exept for the Cascades. Each region has experienced above average snowfall at least once during a Super El Niño year, except for the Pacific Northwest.
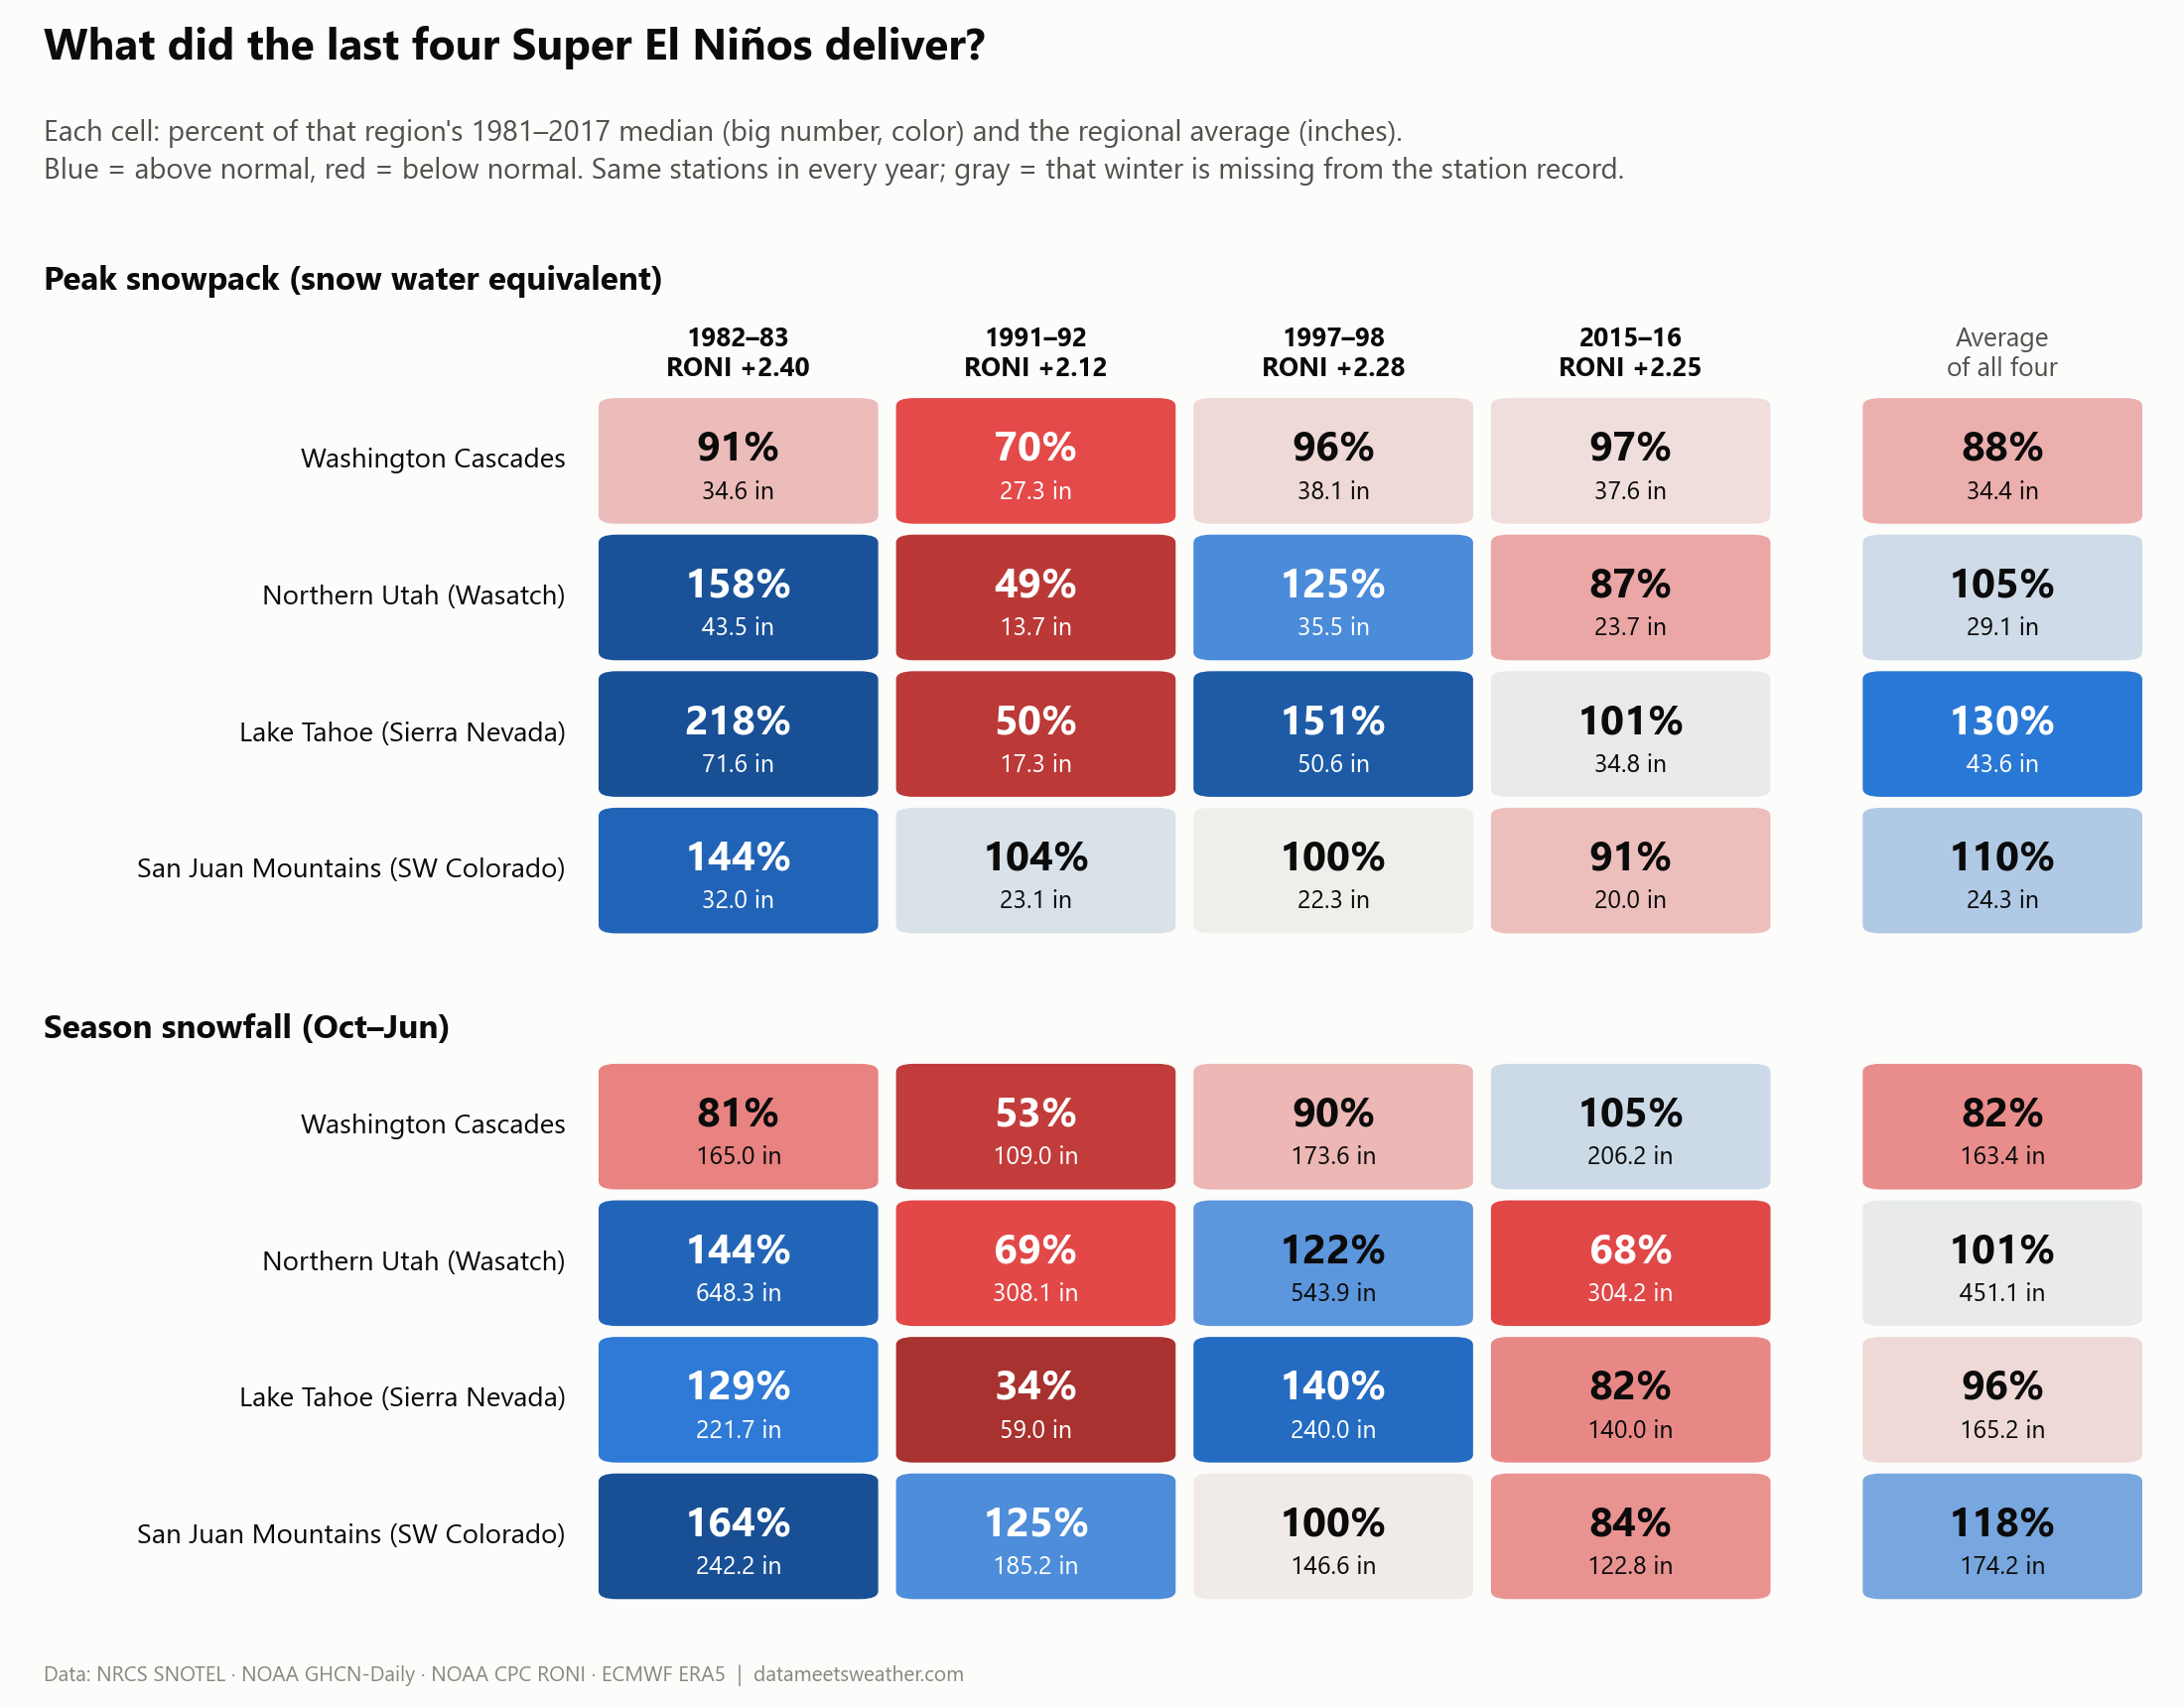
What jumps out is that 1982–83 was a massive season across the board. Tahoe hit 218% of normal snowpack, the Wasatch 158%, the San Juans 144%. Alta and Silver Lake averaged about 648 inches of snowfall. On the other hand, 1991–92 was pretty lame. Tahoe dropped to 50%, the Wasatch to 49%, the Cascades to 70%. Tahoe City got just 59 inches of snow all season. The Cascades never had an extreme year and all four Super El Niños came in under normal snowpack, ranging from 70% to 97% of normal.
Average the four winters and you get something like 88% to 130% depending on the region, which is a pretty large spread. The real story is how different each year is from one another and whether or not it tells us anything for this upcoming season.
Does a stronger El Niño mean more snow?
Not really. Across all 37 winters, El Niño strength barely predicts snowpack anywhere except the Cascades.
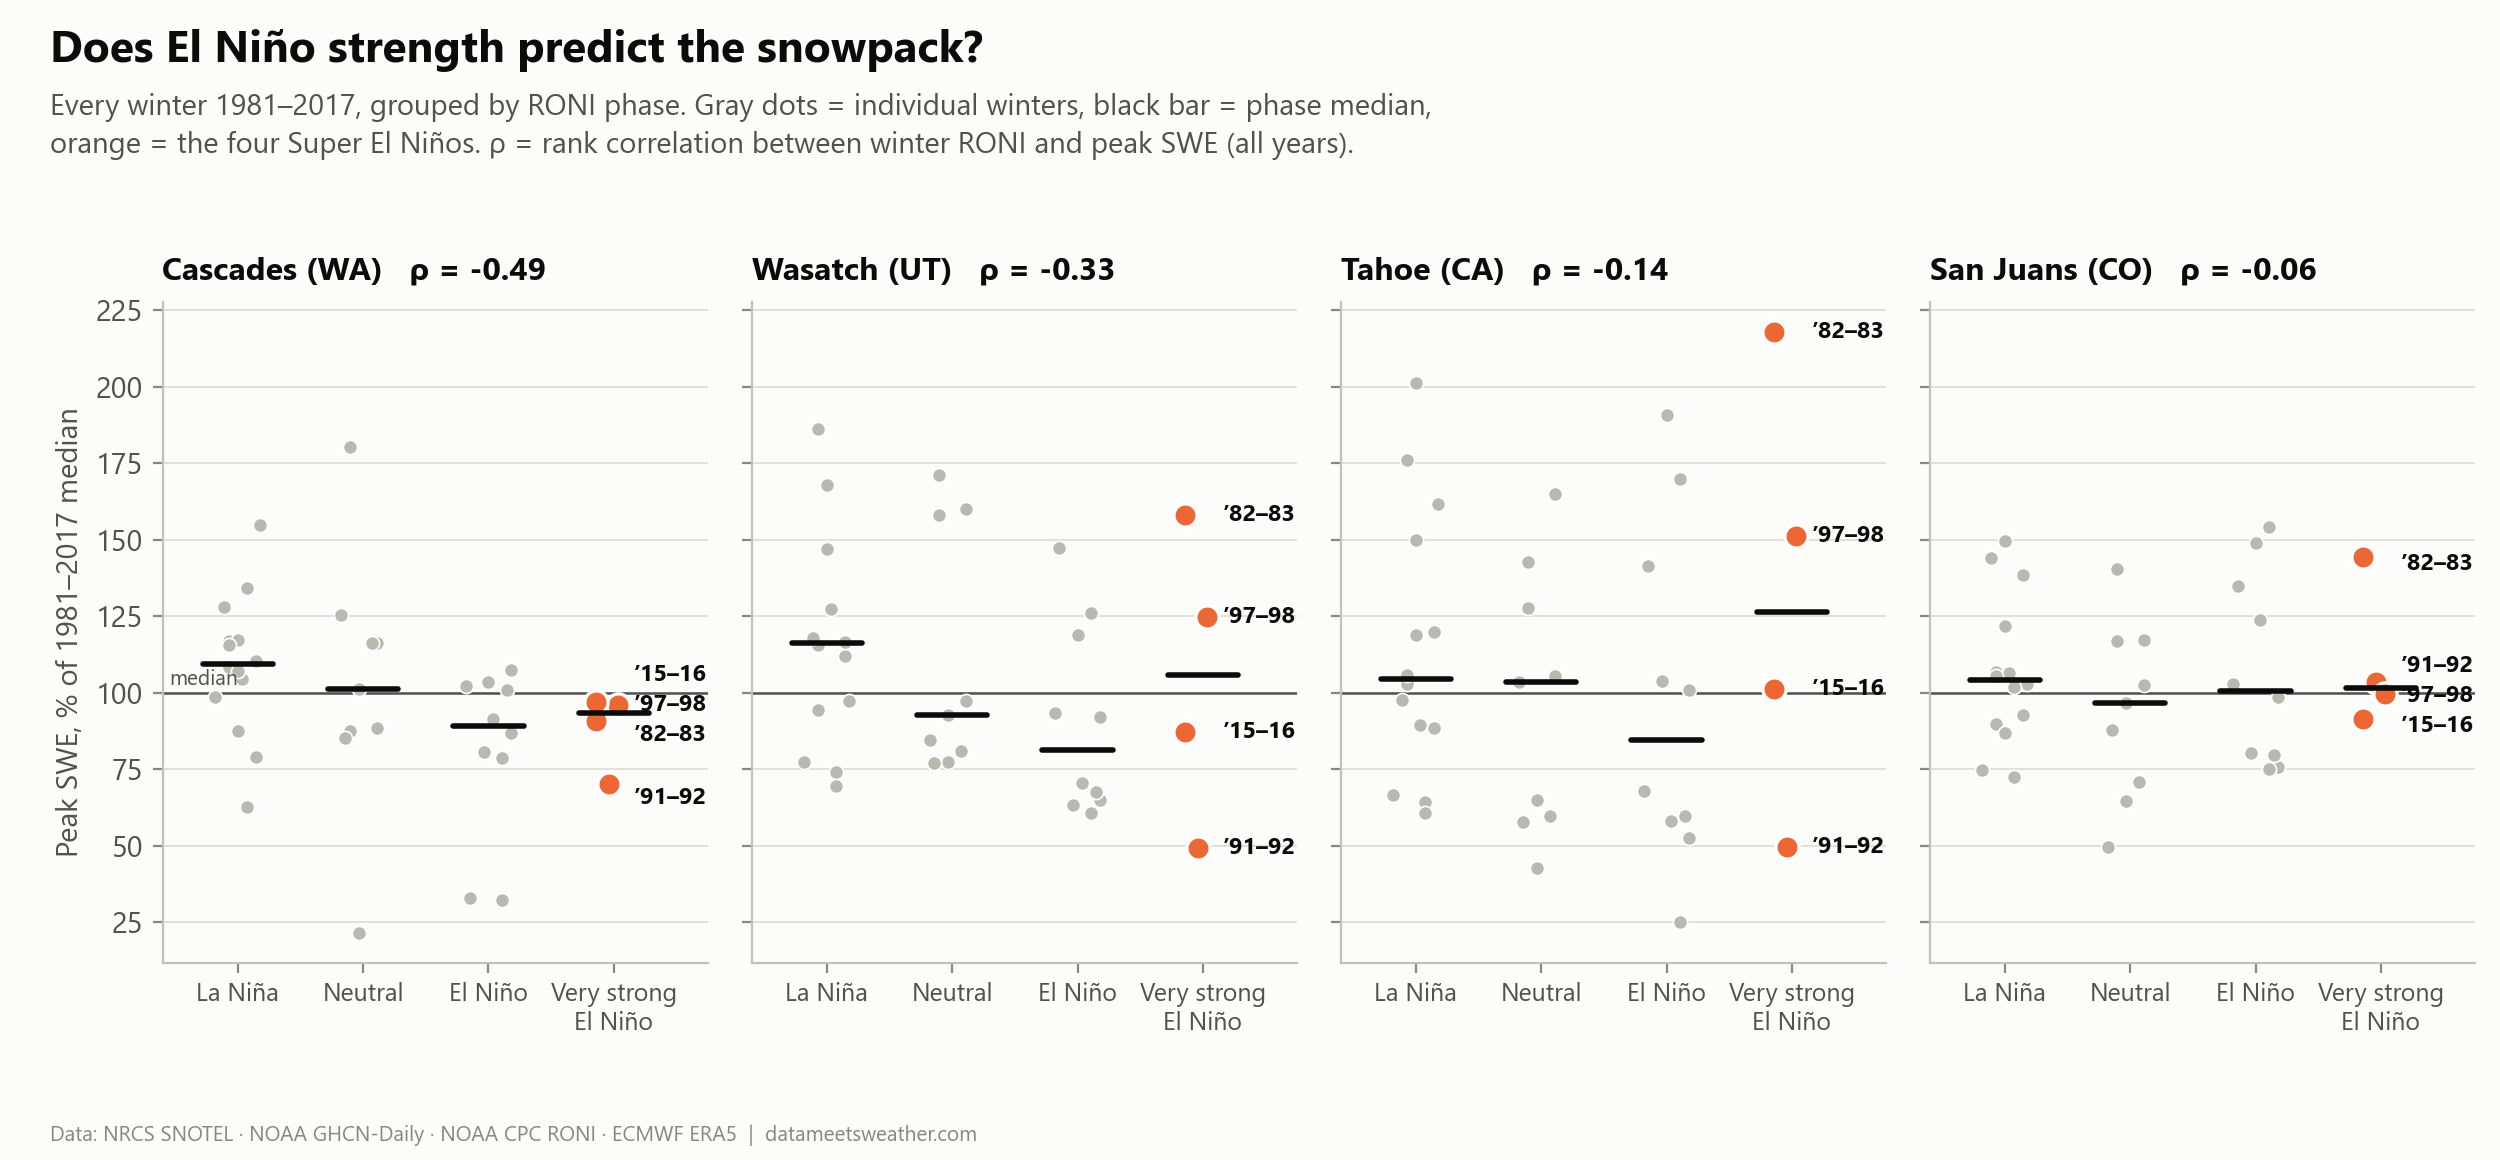
Each gray dot is one winter, sorted by ENSO phase. The orange dots are the four Super El Niños. The ρ number in each title is a rank correlation: +1 would mean "stronger El Niño, always more snow," −1 the opposite, 0 no relationship.
Cascades: ρ = −0.49. A real, statistically solid pattern. Stronger El Niño, less Washington snow.
Wasatch: ρ = −0.33. A weaker lean in the same direction.
Tahoe (−0.14) and San Juans (−0.06): essentially noise.
Notice how the orange dots (the Super El Niños years) in Tahoe and the Wasatch vary largely from the top of the chart to the very bottom. Same ENSO phase between each but completely different winters.
So where did the storms go?
The storms tracked south and largely benefitted the Southwestern US, mostly below all four of the ski regions in this study.
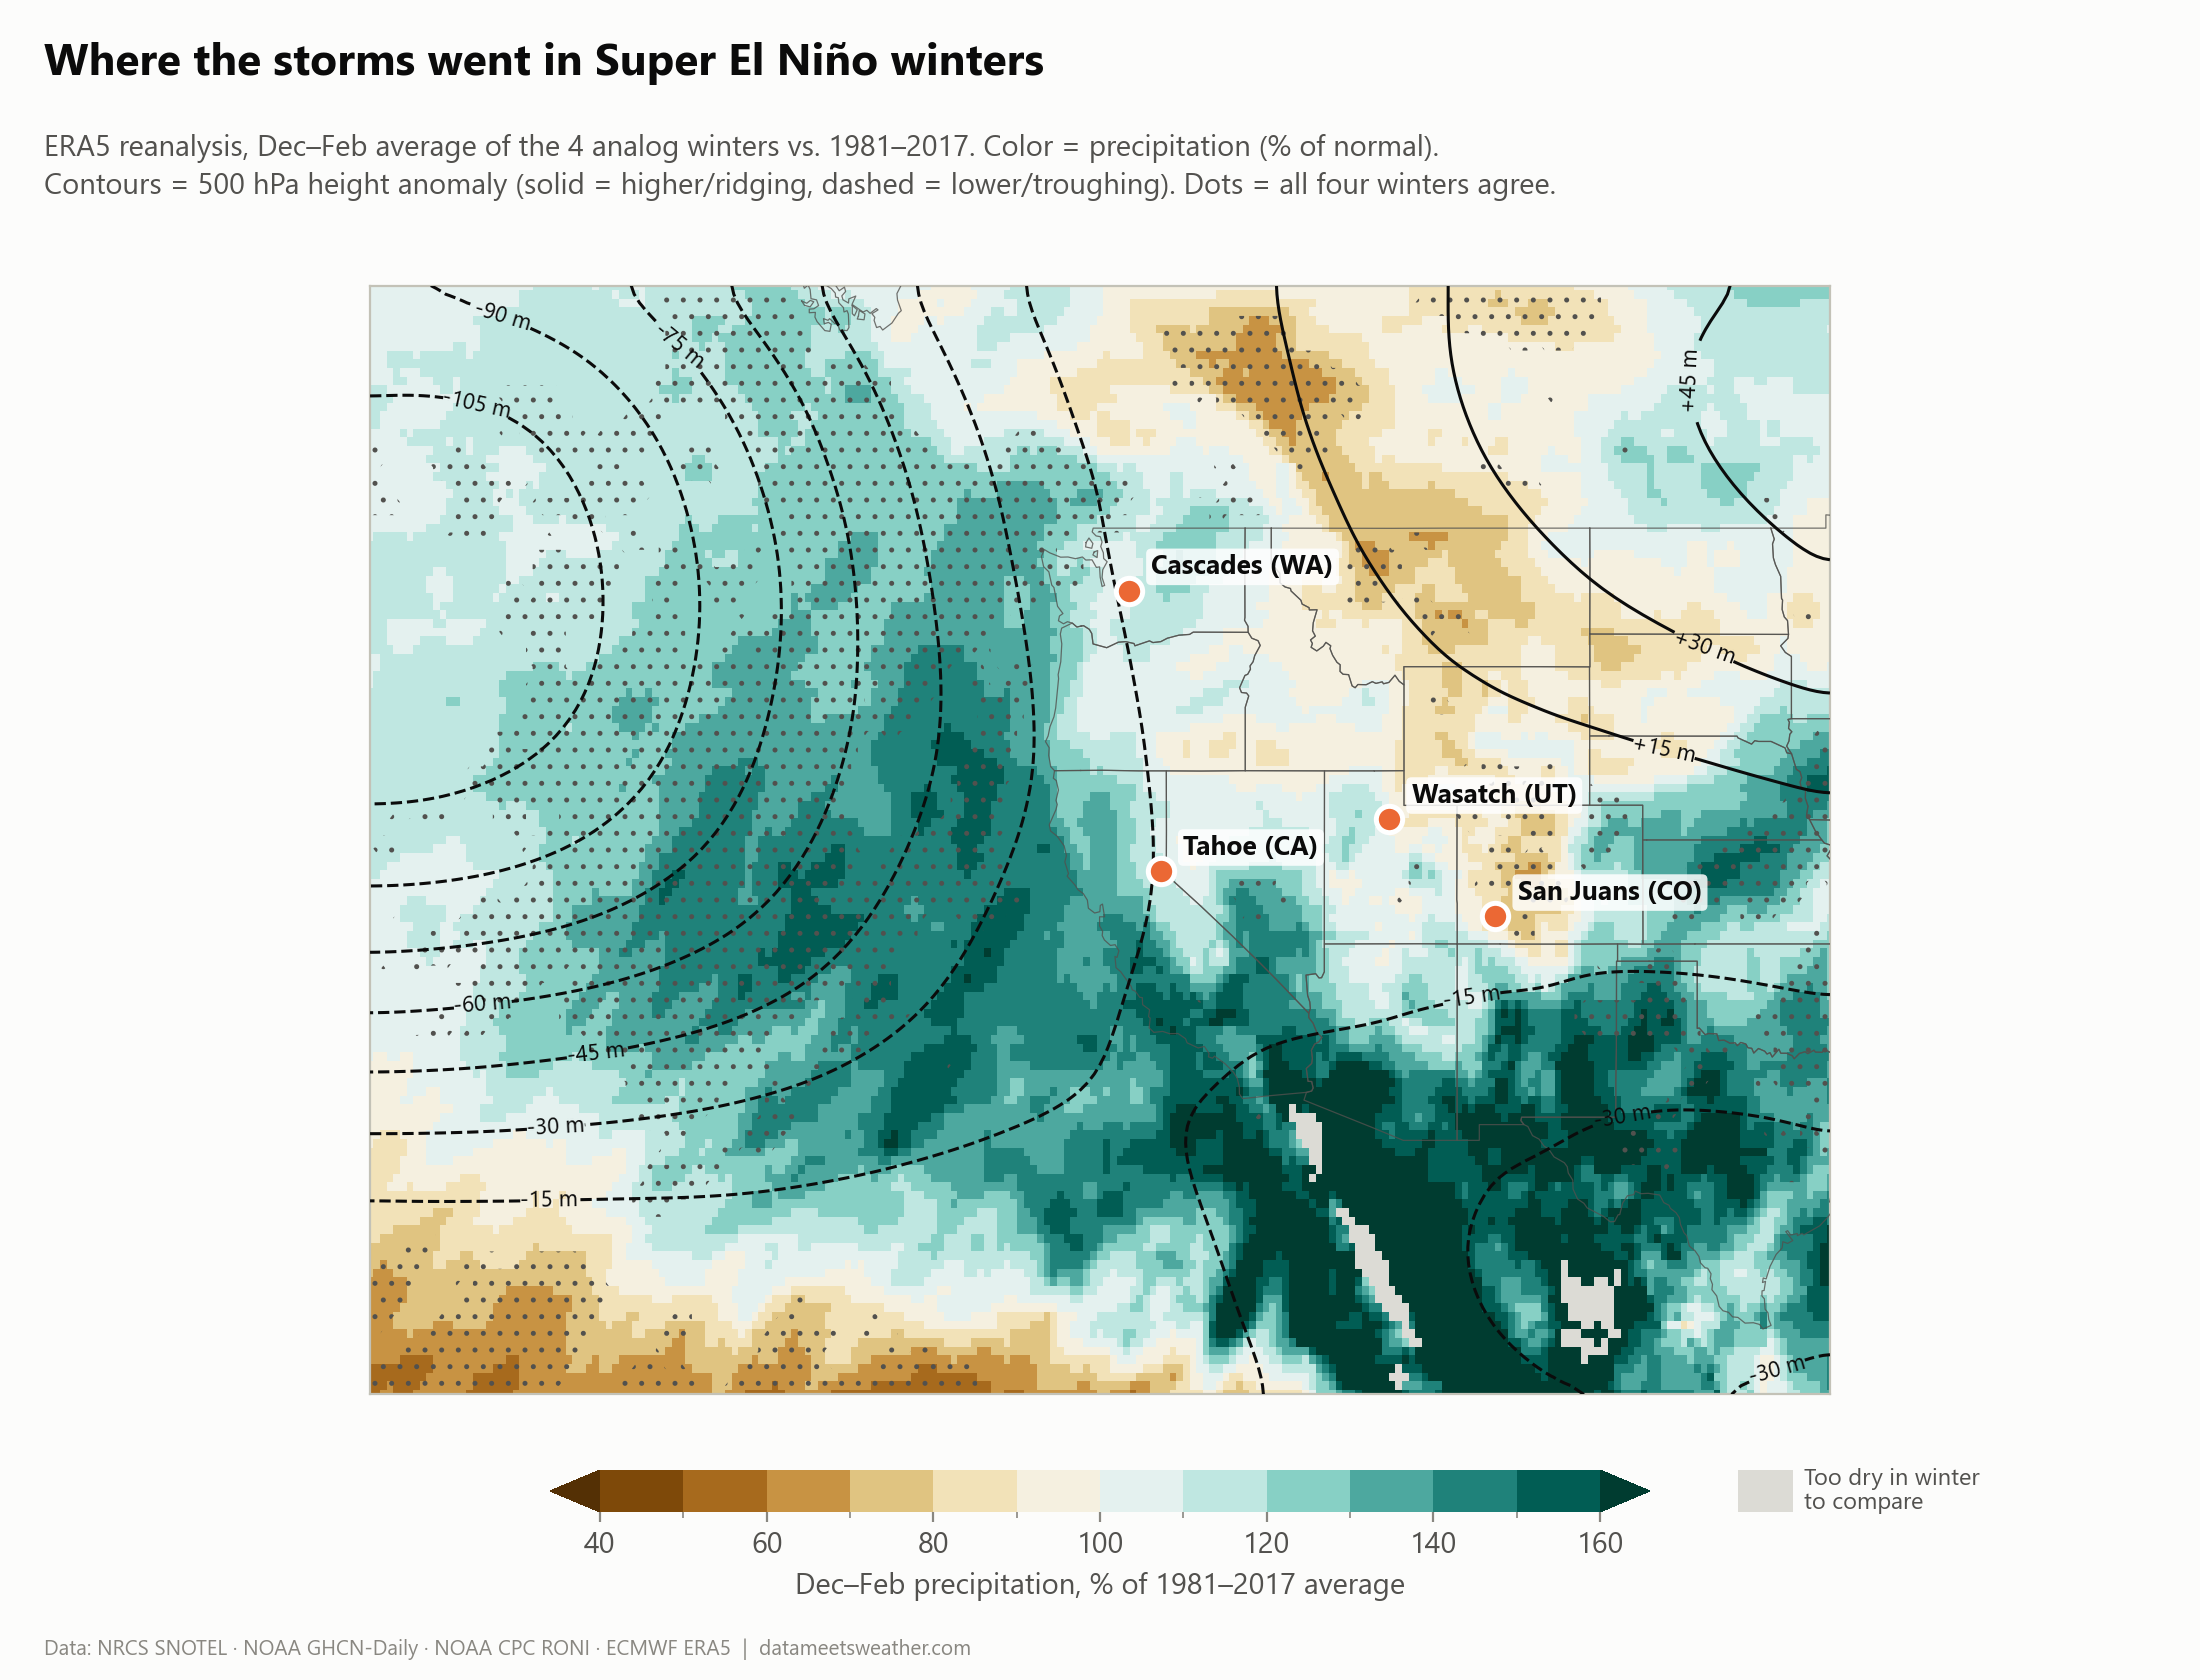
This map averages the four Super El Niño winters (December to February) from ERA5 reanalysis dataset, which is a mathematical reconstruction of the atmosphere every hour since 1940. Green means wetter than normal and brown means drier than normal. The lines show the jet stream's shape at about 18,000 feet.
Here's the textbook pattern, in plain English:
A deep dip (a trough) in the jet stream sits off the West Coast (the dashed lines, up to about 105 meters lower than normal). The dots underneath mark where all four winters agreed on wetter or drier conditions.
The deep trough aims the storm track toward Southern California, Arizona and New Mexico, which ran 160%+ of normal.
A ridge over the northern Rockies (the solid lines) keeps Idaho, Montana, and parts of Wyoming dry.
Three of our ski regions sit right on the edges. Tahoe catches the northern rim of the wet zone. The Wasatch and San Juans sit near the line between wet and dry, so a small wobble in the storm track decides their winter.
Too dry or too warm?
When a Super El Niño winter flops, the usual suspect is warmth: storms arrive, but precipication falls as rain instead of snow. The data says that's mostly not what happens.
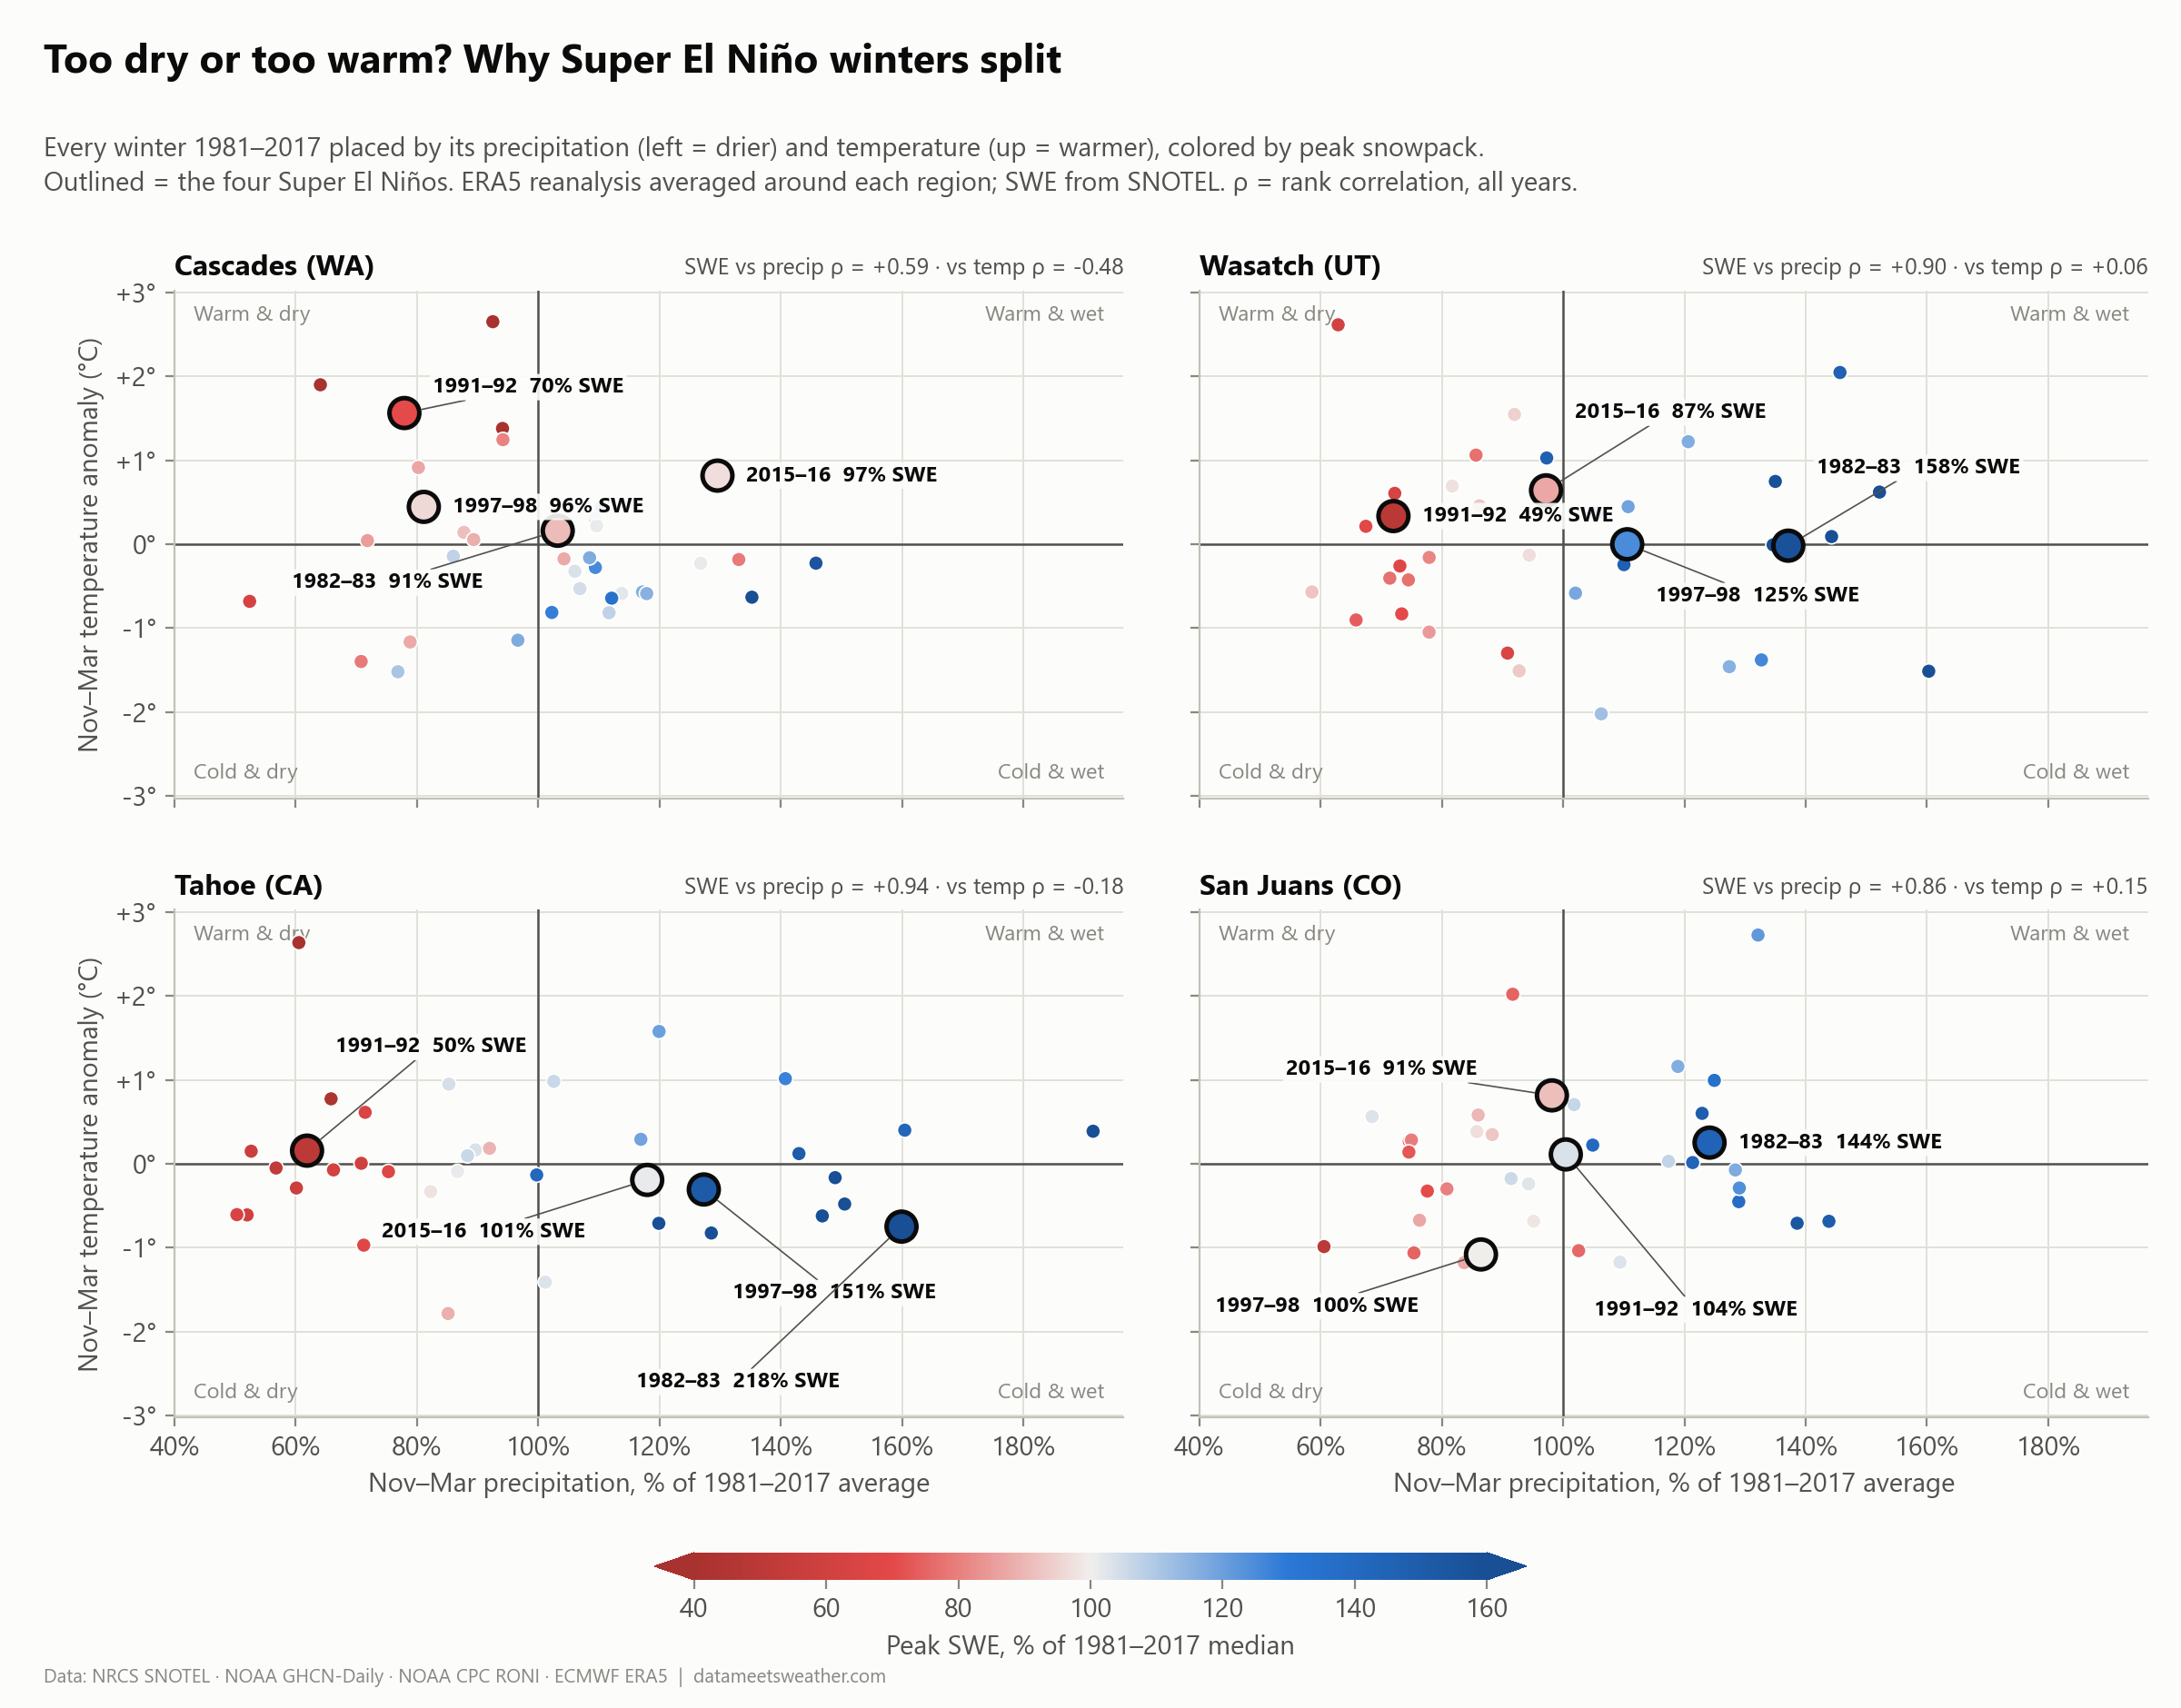
Each dot is a winter, placed by how wet (left to right) and how warm (bottom to top) it was, and colored by how the snowpack turned out. Blue means a good year, red a bad one.
In the Wasatch, Tahoe and the San Juans, it's all about precipitation. Snowpack follows how much it storms almost perfectly (ρ = +0.86 to +0.94), and barely cares about temperature. These stations are high enough that a slightly warm winter still falls as snow.
1991–92 was a dry bust, not a warm one. Precipitation was 72% of normal in the Wasatch and 62% at Tahoe, at near-normal temperatures. It was the tail end of a long western drought.
The Cascades are the exception. They're lower and closer to the ocean, so temperature matters (ρ = −0.48). In 2015–16 they got 130% of normal precipitation, but the winter ran 0.8 °C warm and the snowpack only reached 97%. A lot of that precipitation fell as rain.
So what does history say about 2026–27?
It says that the odds are weird. Only the Cascades lean one way confidently, and that lean is below normal, unfortunately.
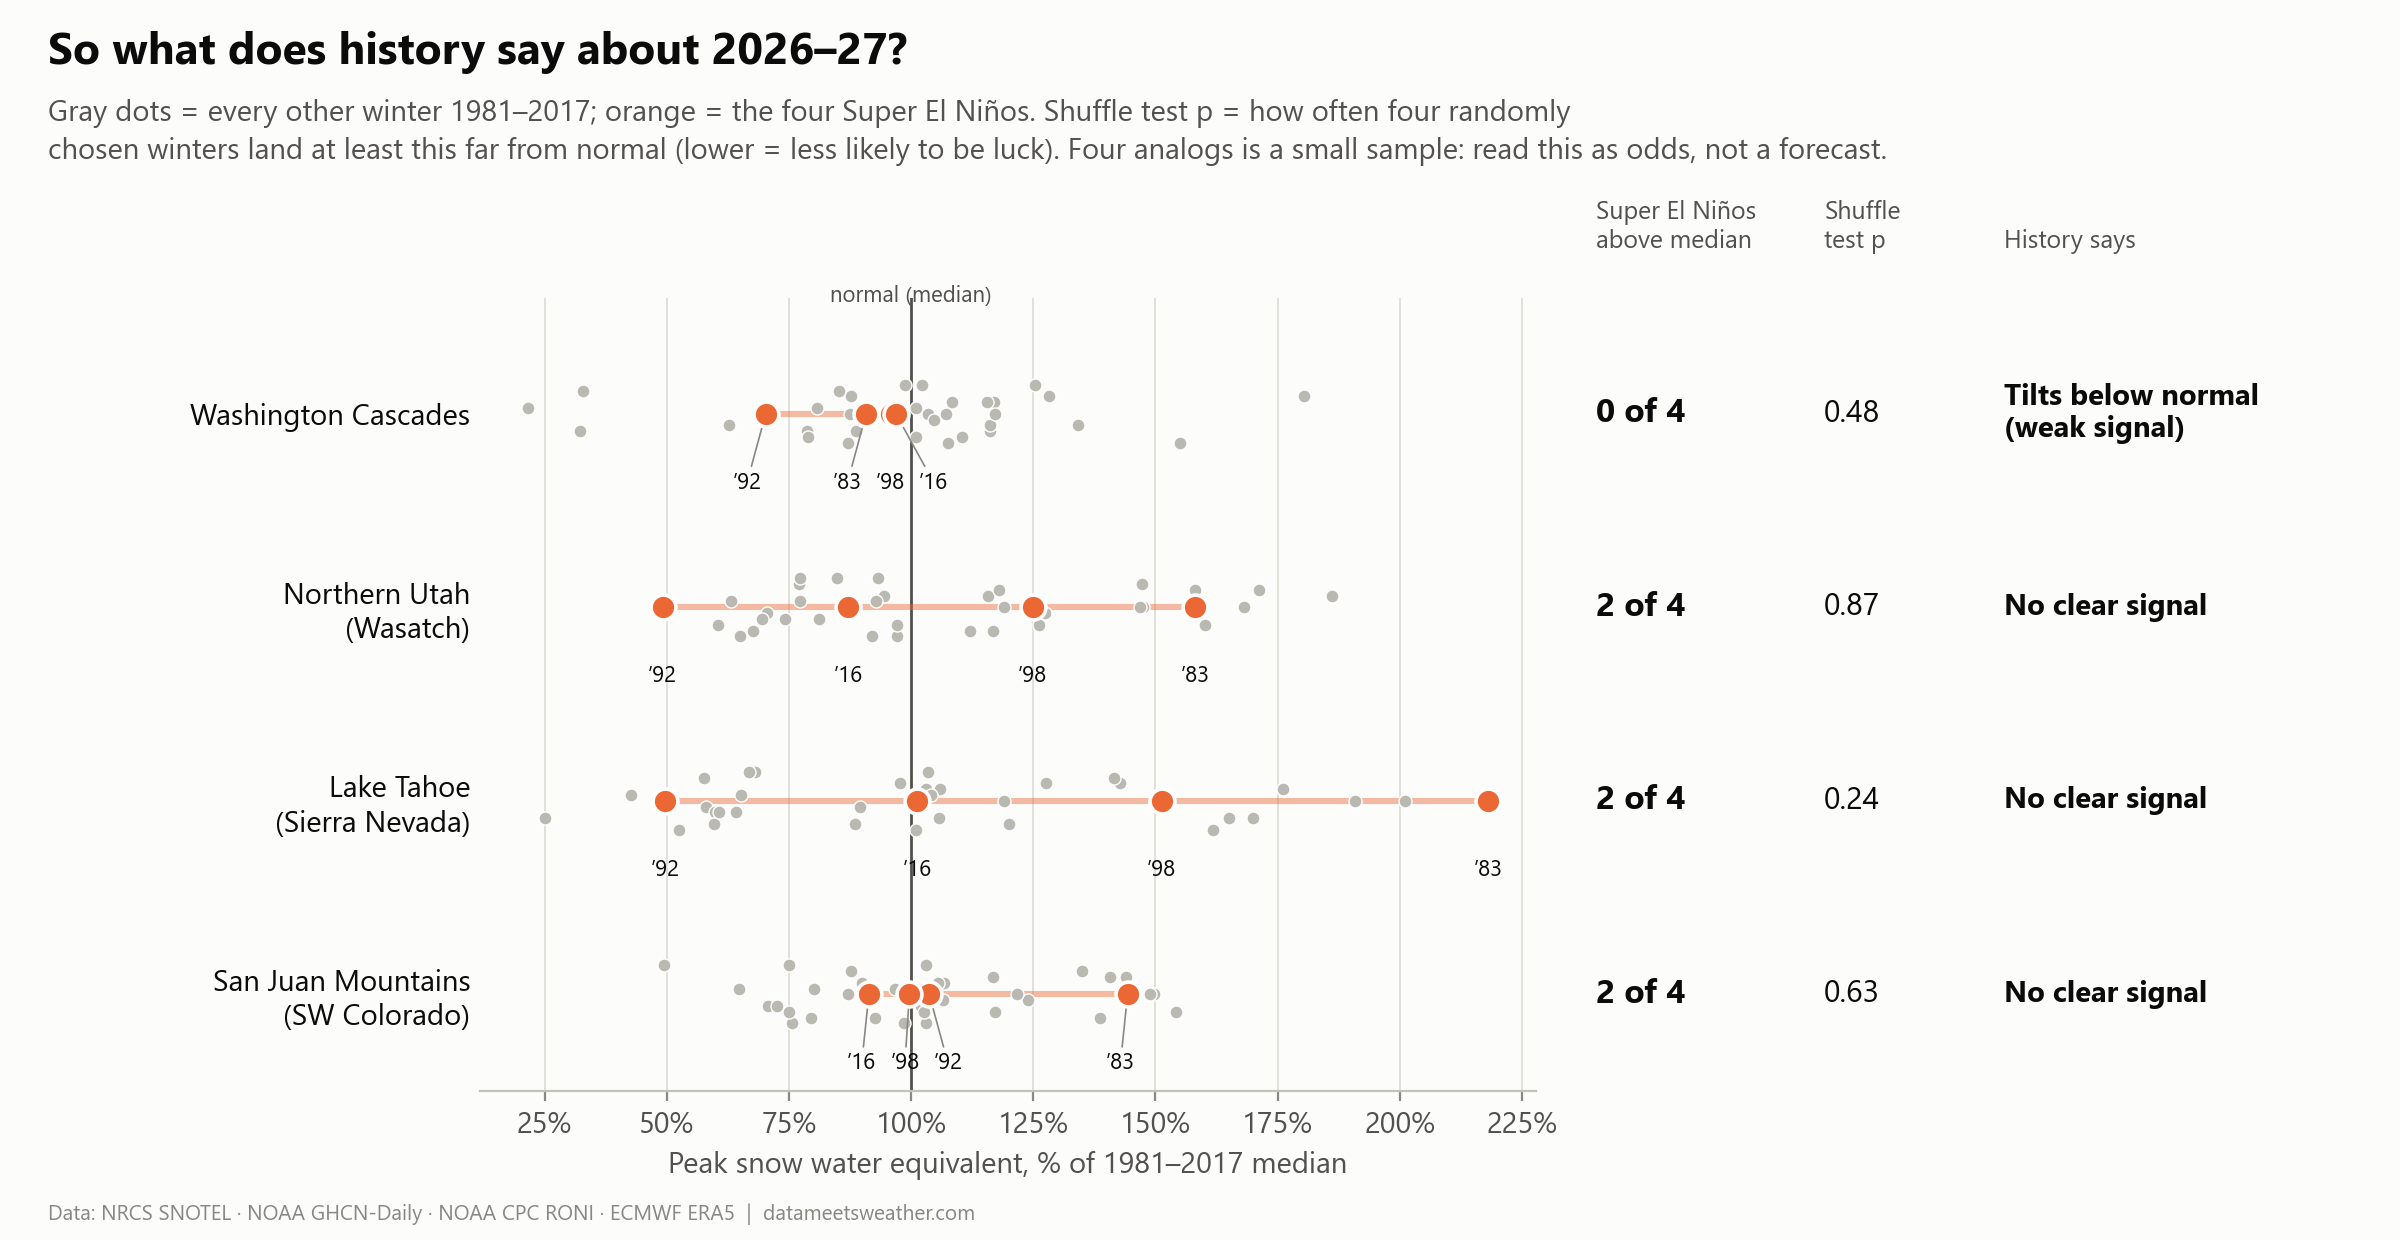
The "shuffle test" is my favorite sanity check. I picked four random winters from the record, thousands of times, and asked: how often do four random winters look as unusual as the four Super El Niños? If the answer is "often," the Super El Niño pattern could just be luck. A low p (under about 0.1) would be worth getting excited about.
My takeaway as a meteorologist (and a skier): El Niño loads the dice, but it loads them for Southern California and the desert Southwest, not for our four regions. At best, I think the Wasatch will have a slightly above average snowfall this season. Given how extreme this year’s El Niño is forecasting, I’m hoping that the Southwestern forecast (cooler and wetter) creeps up to Northern Utah. I’m hoping that the Southwest has a killer ski season because all signs are pointing toward that, so long as temperatures stay cool enough. It’s looking bleak for the Pacific Northwest but I have a hunch that this year will also be closer to average. Lake Tahoe is a wildcard for me and is subject to atmospheric river events and lake effect snow. I think there will be plenty of moisture to feed an atmospheric river.
What decides your winter comes down to where the storm track sets up storm by storm. Watch NOAA's monthly outlooks for temperatures and moisture— They'll tell you more than the El Niño headline.
Read this with a grain of salt
Four winters is a tiny sample. Treat the results as odds, not a forecast.
This El Niño is forecast to be stronger than any of the four, so it almost doesn’t even make sense to compare to historical storms.
It's warmer now than in 1983. Peak snowpack in the Wasatch, Tahoe and the San Juans has slid about 5 to 7 percentage points per decade since 1981, and last winter showed how warmth can wreck a normal-precipitation year.
"Normal" here means the 1981–2017 median at each station, not NRCS's official 1991–2020 normals.
How I did it
Super El Niño winters: NOAA CPC's RONI of +2.0 °C or higher (strongest of Oct–Dec, Nov–Jan, Dec–Feb).
Snowpack: NRCS SNOTEL, 1981–2017. Only stations with data in all four Super El Niño winters: 4 in the Cascades, 5 in the Wasatch, 7 at Tahoe, 4 in the San Juans.
Snowfall: NOAA GHCN-Daily co-op stations: Longmire and Holden Village (WA), Alta and Silver Lake Brighton (UT), Tahoe City (CA), Telluride and Lemon Dam (CO).
Atmosphere: ECMWF ERA5 monthly reanalysis (500 hPa heights, precipitation, 2 m temperature).
Stats: rank correlations, a 20,000-draw permutation ("shuffle") test, and no regression on four data points.
