This past winter, the San Juan snowpack peaked at 10.3 inches of snow water equivalent (SWE), based on the average across seven SNOTEL stations that sit between about 10,000 and 11,000 feet. In 2022-23, the same stations peaked at 34.2 inches. A typical winter since the early 1990s lands closer to 24.
ENSO is usually the first suspect. In a good year it collects the credit. In a bad year it also collects the credit. Continuing my series where I explore how much impact, or how little, ENSO actually has on a region, this week we’re looking at the Southwest, using the San Juan as a proxy. The method is the same as the previous locations: SNOTEL snowpack, valley temperature and precipitation (Durango, this time), upper-air conditions, and 35 years of the Oceanic Niño Index (ONI), the standard measure of how warm or cold the equatorial Pacific is running compared with normal.
I found that the San Juans show no connection between ENSO and snowpack. There is, however, a weak relationship to temperature.
The Two Seasons, Side by Side
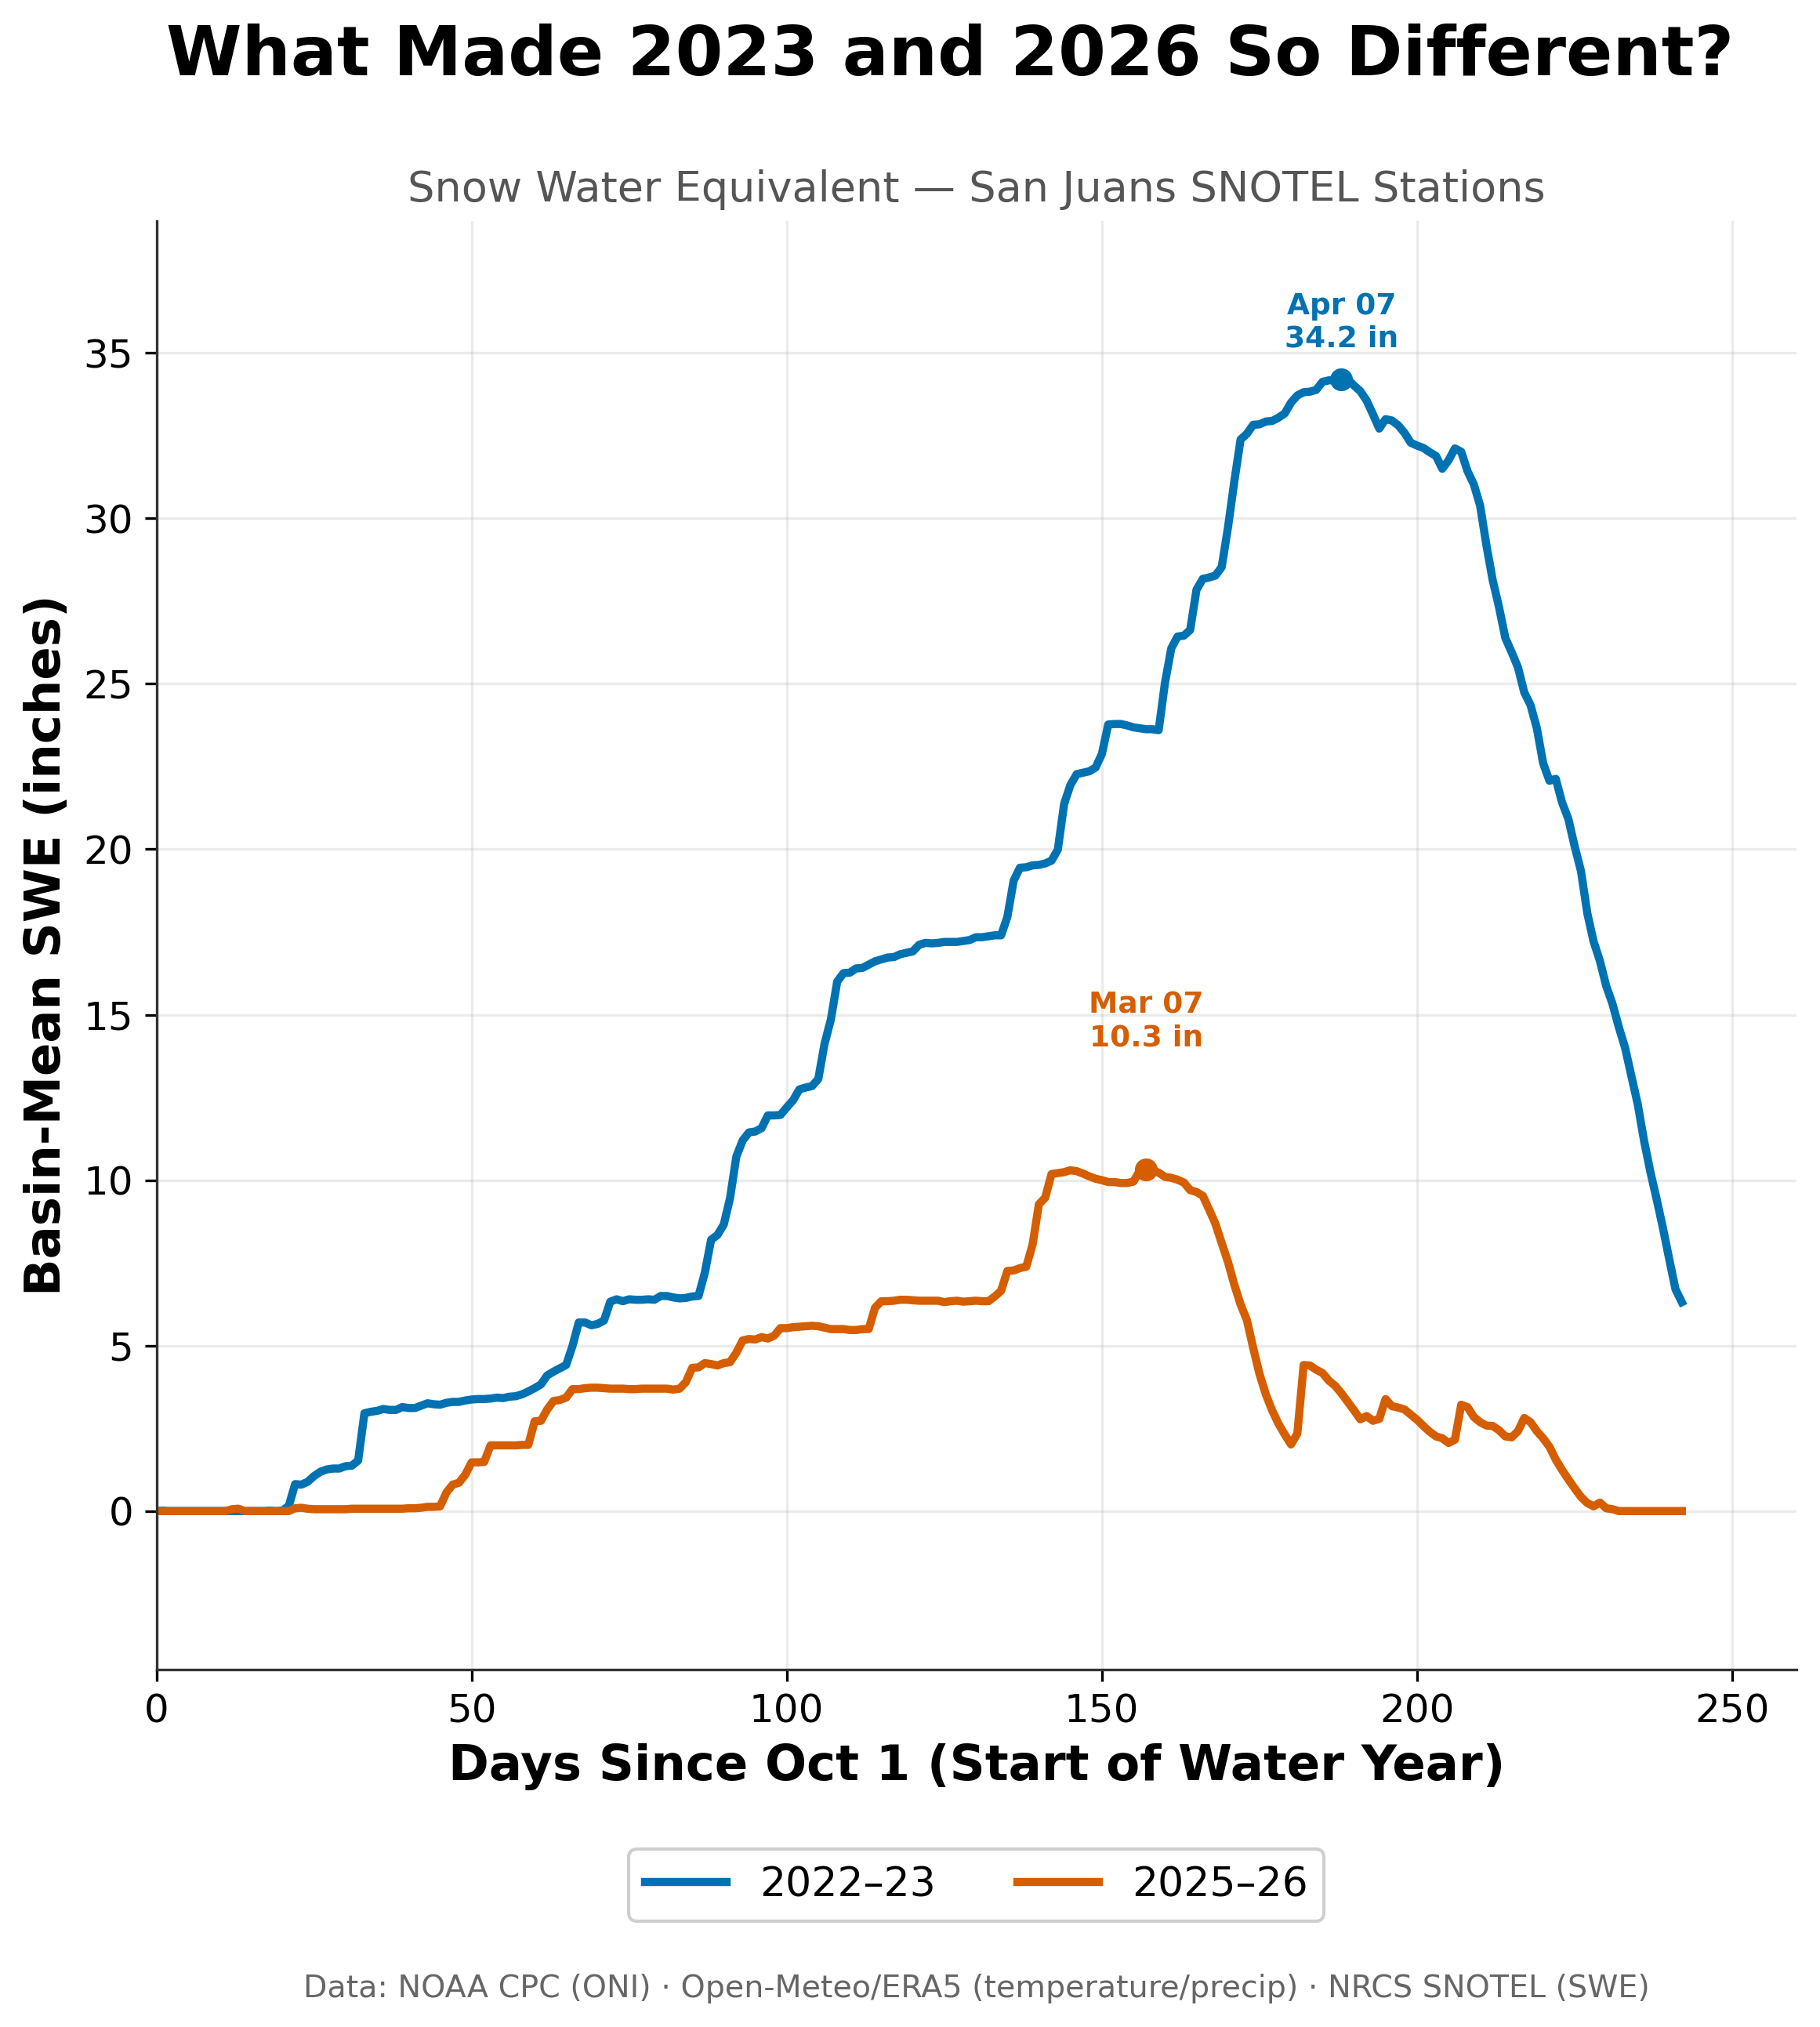
Average snow water equivalent at seven San Juan SNOTEL stations (10,000 to 11,000 ft). The 2025-26 snowpack peaked at 10.3 in on March 7, a month earlier and at less than a third of the 34.2 in reached on April 7, 2023.
2022-23 was a big year, roughly one of the six largest peaks of the last 35 winters. 2025-26 reached less than half of a typical peak, about 70 percent below 2022-23, and got there a month early: March 7 instead of April 7.
By the end of March, the basin mean had dropped to roughly 2 inches, which is about 80 percent of the snowpack's water gone in around three weeks. A few spring storms added back a couple of inches but those melted too. The stations were bare by about May 20. On May 31, the 2022-23 stations still held roughly 6 inches.
Every station here sits above 10,000 feet. If the high country was this thin, the terrain below it likely fared worse.
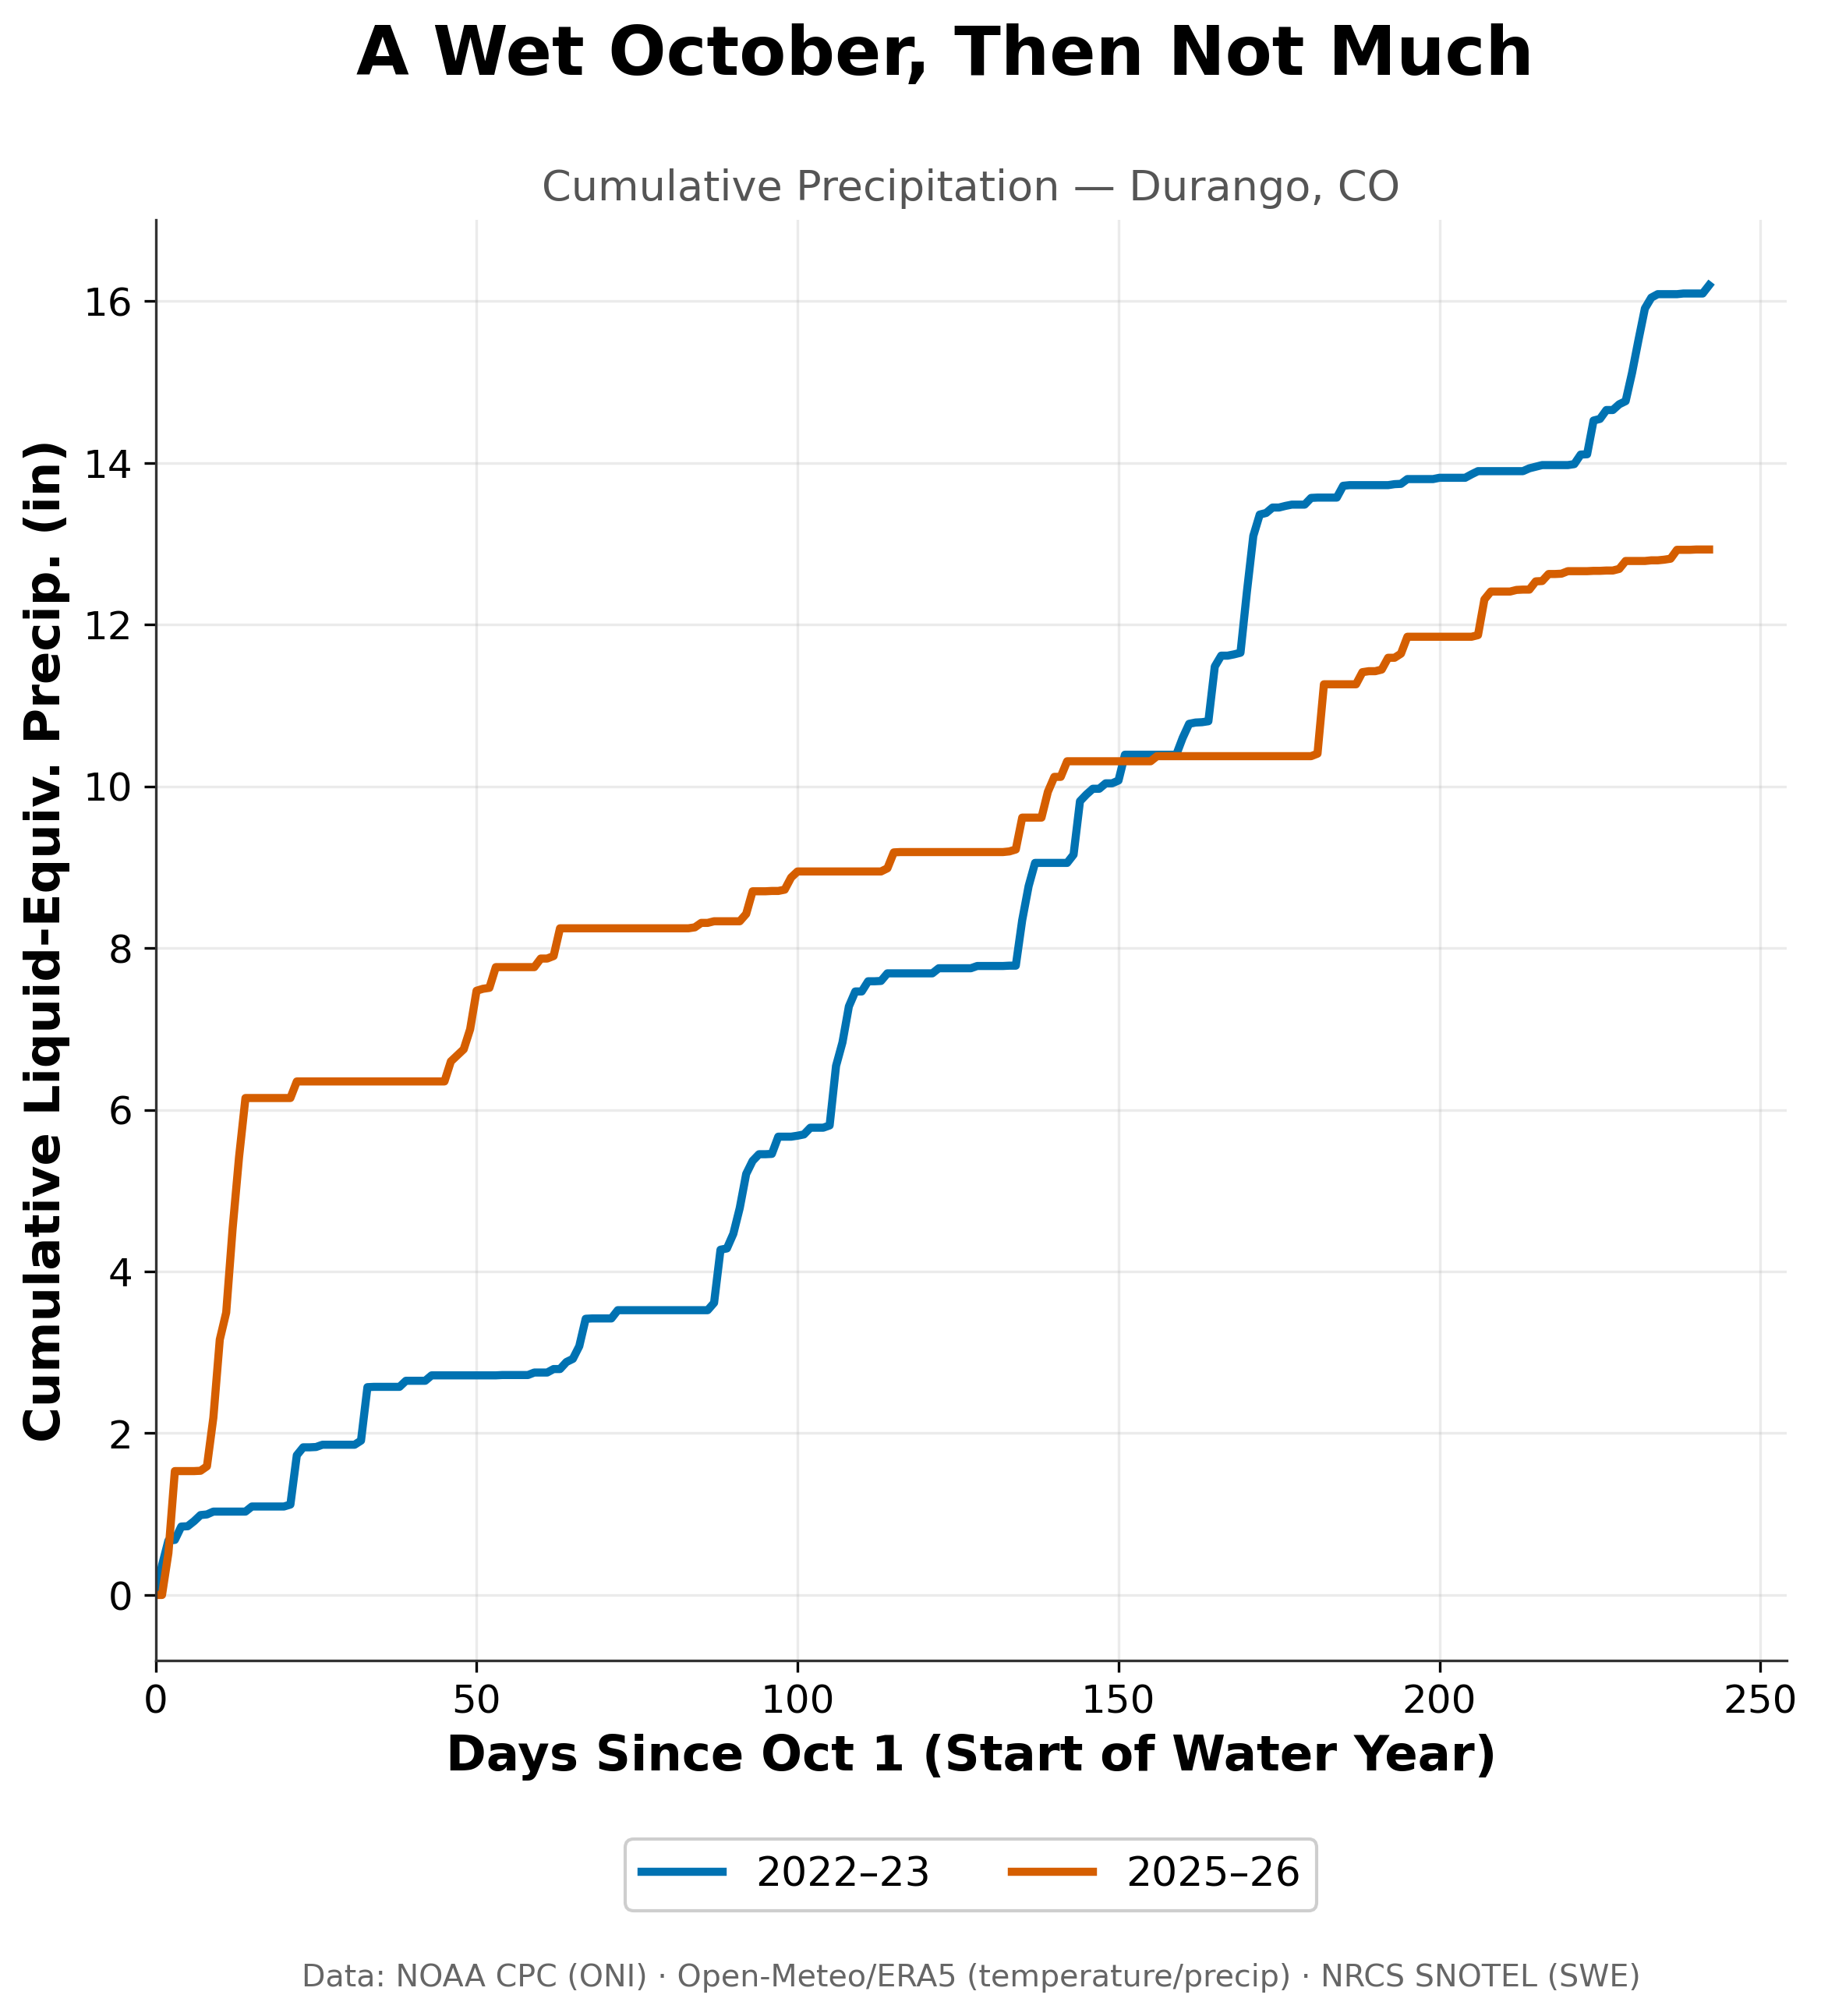
Cumulative precipitation at Durango, CO, starting October 1. A wet first two weeks of October kept 2025-26 ahead through February, but that moisture arrived before the snowpack started building, and 2022-23 finished about 3 in ahead.
Storm frequency is an obvious first suspect and the precipitation record gives a mixed answer. Durango collected about 12.9 inches from October through May in 2025-26, against 16.2 inches in 2022-23. That is roughly 20 percent less. It is a real gap but not huge.
However, the timing is more revealing. About 6 inches of the 2025-26 total fell in the first two weeks of October, while the SNOTEL sites were still bare, and SWE did not start building until mid-November. From that point on, Durango picked up roughly 6.5 inches, compared with roughly 13.5 inches in 2022-23. That is about half as much during the stretch of the year that builds and sustains a snowpack.
In short, the storms came but precipitation likely didn’t fall as snow.
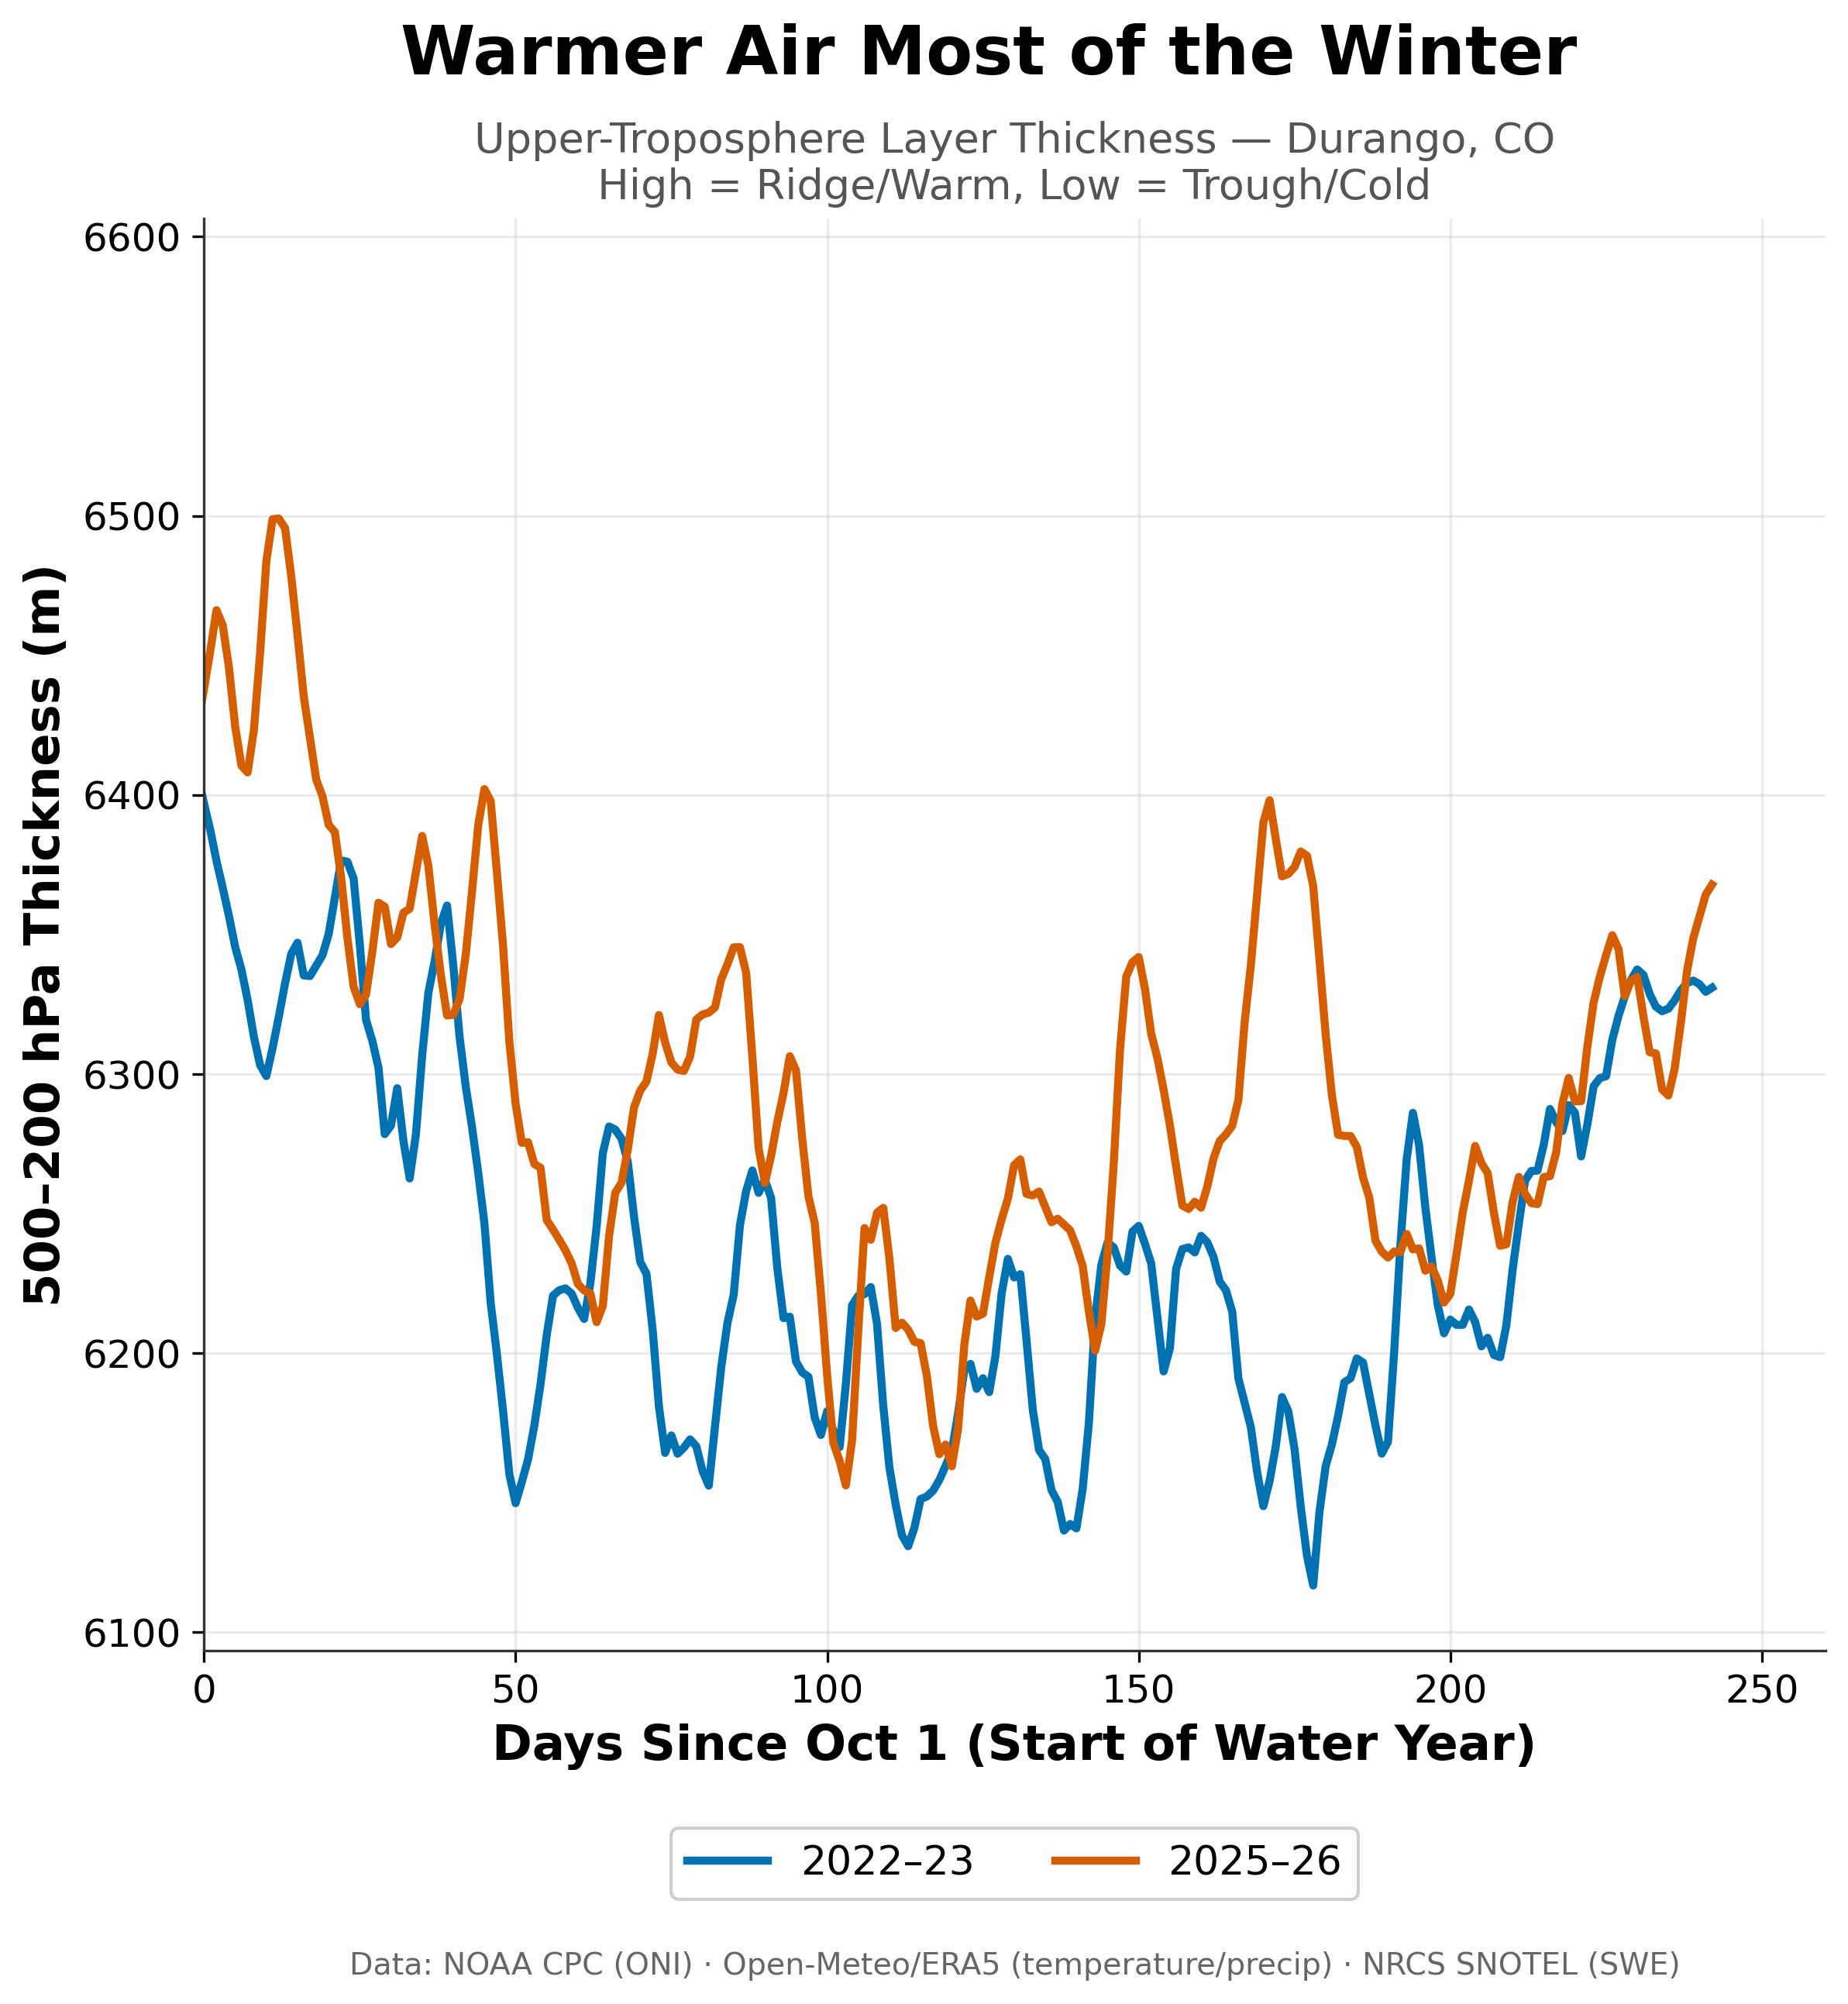
Thickness of the air layer between the 500 and 200 mb levels (roughly 18,000 to 39,000 ft) over Durango. Higher means a ridge and warmer air, lower means a trough and colder air. 2025-26 ran higher for most of the winter, including a spike in the third week of March as the snowpack was losing most of its water.
The second suspect for a crappy winter is temperature. The figure above tracks the thickness of the layer between the 500 and 200 millibar levels. Think of thickness as the temprefor the whole air column: higher values mean a ridge and warmer air, lower values mean a trough and colder air.
2025-26 ran higher than 2022-23 for most of the winter, and two stretches stand out. In mid-October, the column spiked near 6,500 meters just as that early moisture arrived, which fits rain rather than snow, and fits the bare SNOTEL sites. In the third week of March, thickness climbed to around 6,400 meters, and that appears to line up with the stretch when the snowpack lost most of its water.
The surface observations point the same way. Durango's coldest daily average temperature of the year was about 18°F in 2025-26, compared with about 7°F in 2022-23. At the SNOTEL stations, none of the seven recorded a daily average below 0°F this past winter, while at least one reached -4°F in 2022-23. Across the full June-to-May year, Durango averaged nearly 6°F warmer (51.1°F versus 45.3°F).
Does ENSO Help Explain Any of This?
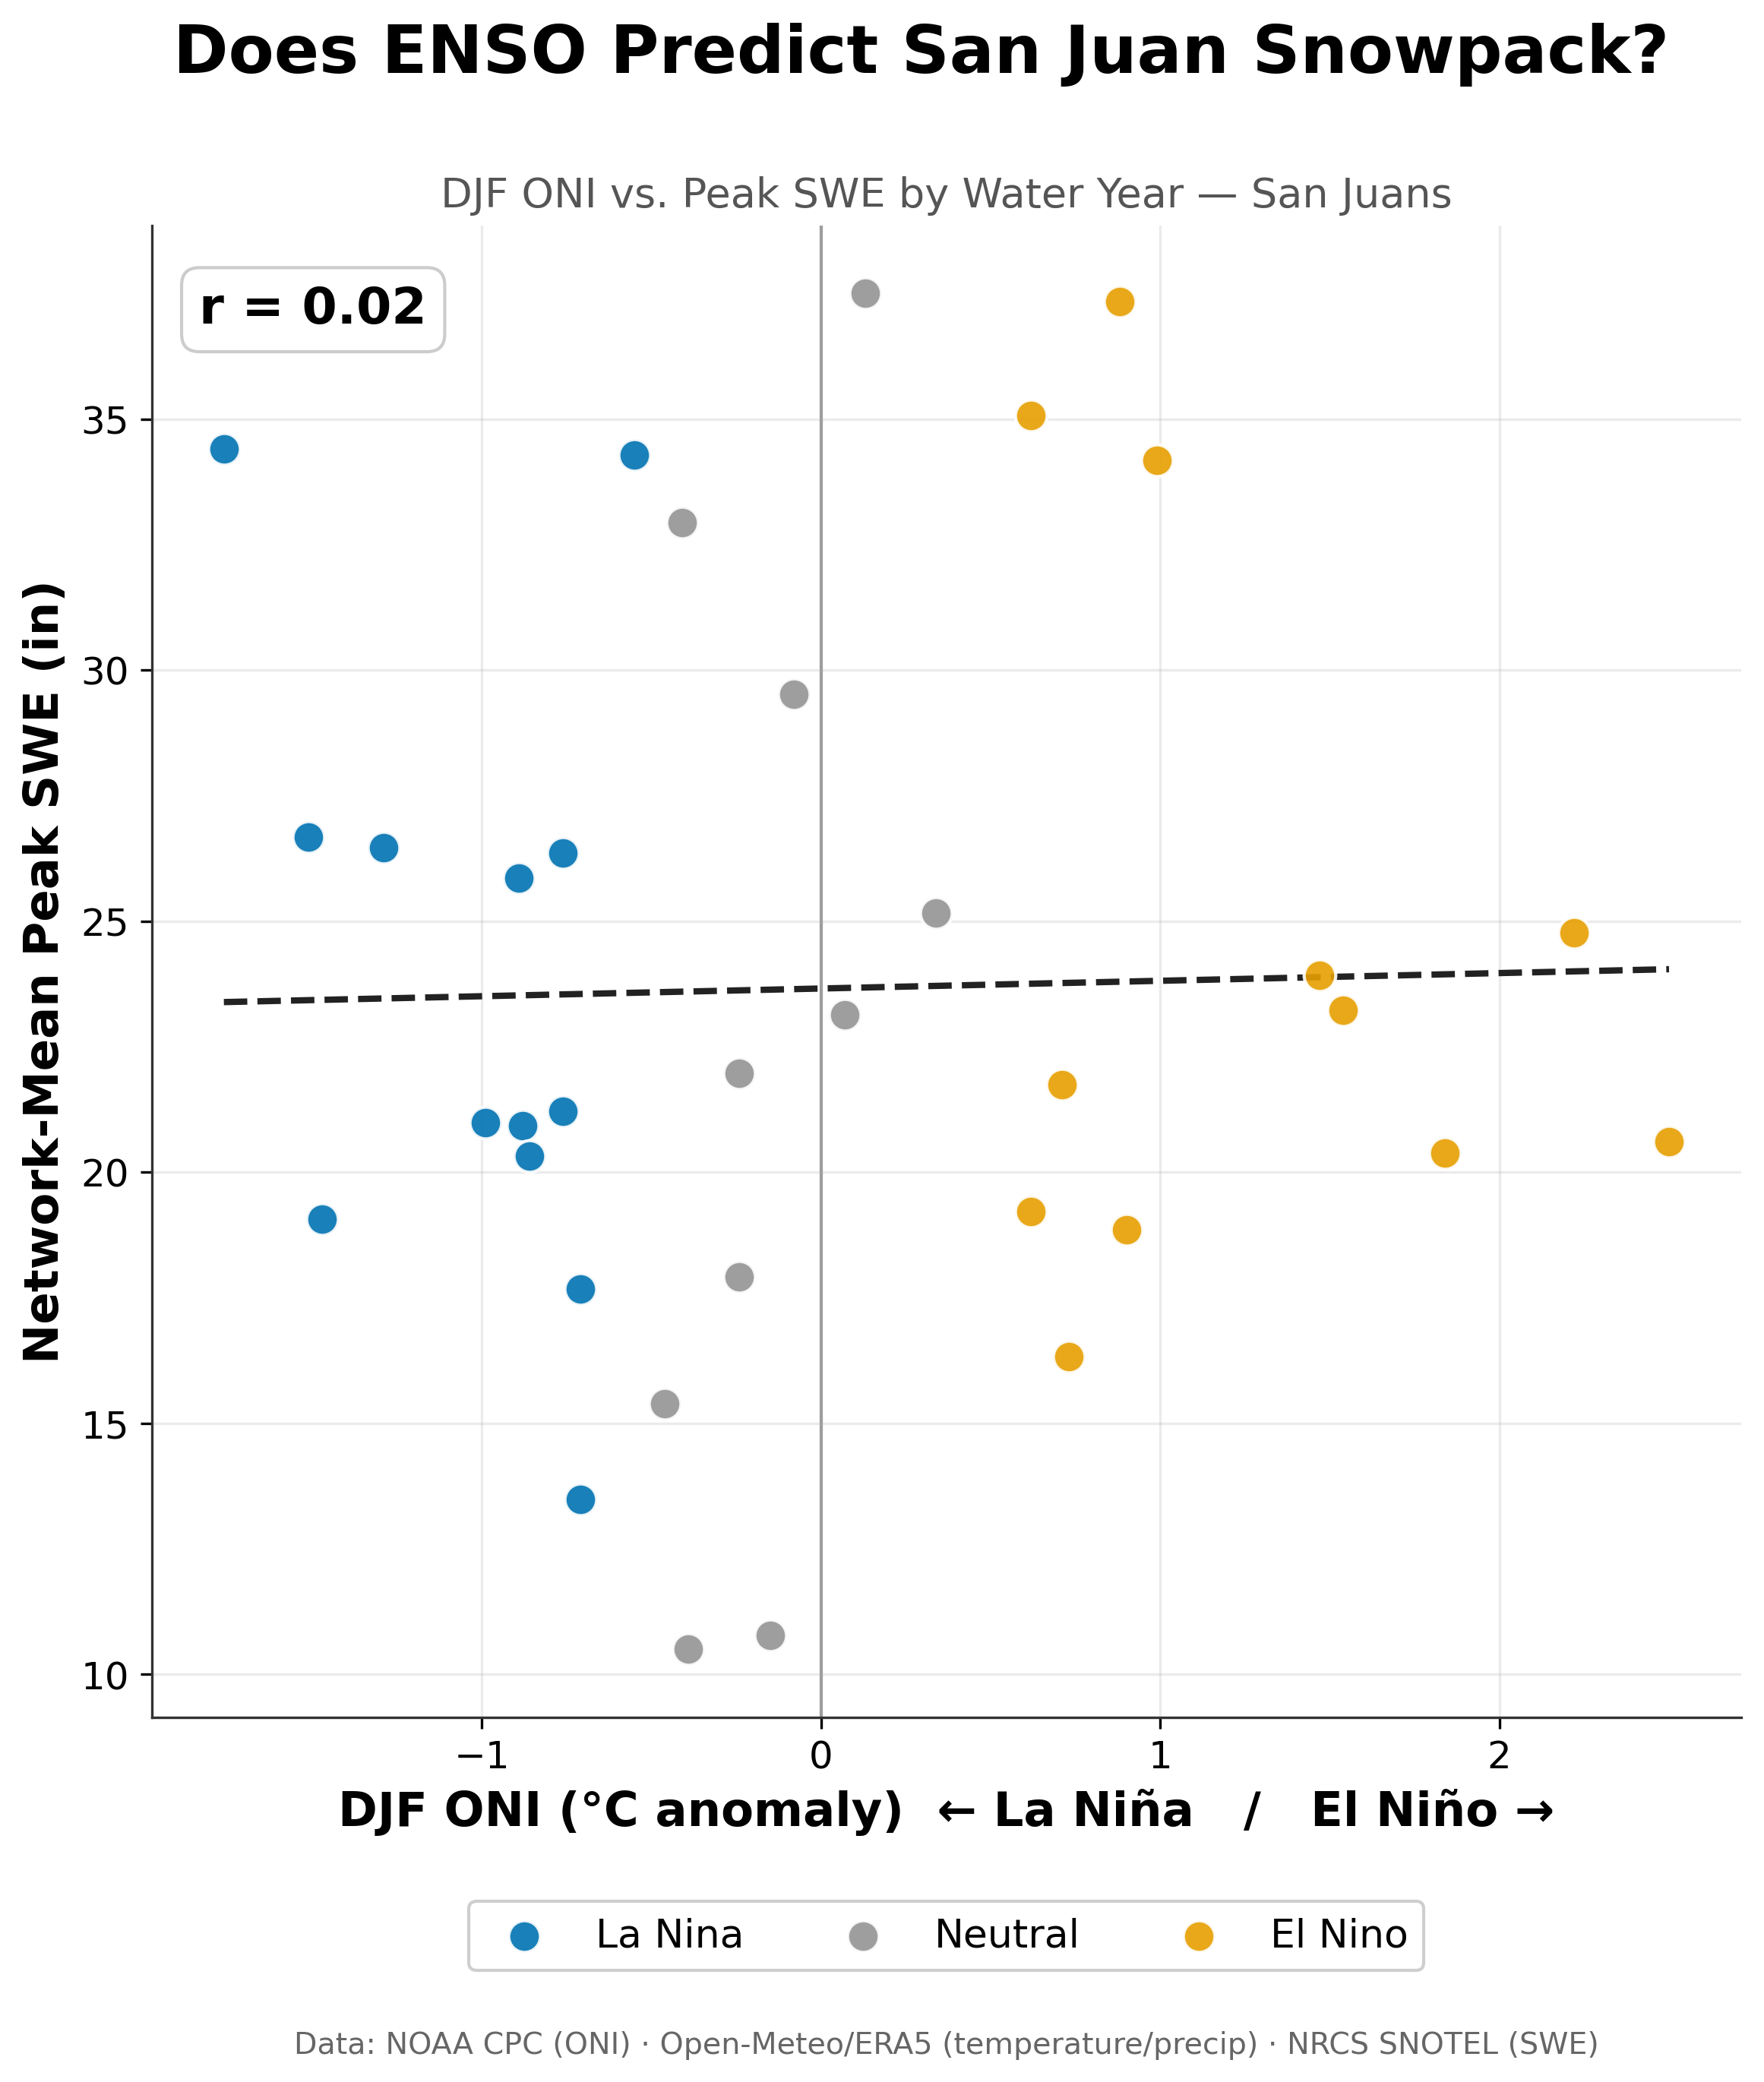
Each dot is one winter since 1992, with DJF ONI on the x-axis and peak snowpack on the y-axis. Strong La Niña and El Niño winters both land across nearly the full range of outcomes, and the correlation is close to zero (r = 0.02).
Not for snowpack. The correlation between winter ONI and peak SWE across 35 water years is 0.02. (A correlation of 0 means no linear relationship, and +1 or -1 means a perfect one.)
La Niña winters range from about 13 to 34 inches. El Niño winters range from about 16 to 37 inches. The five strongest El Niños in the record, with an ONI near +1.5 or higher, produced peaks between about 20 and 25 inches. That is right around average, with no standout in either direction. Neutral winters produced both the deepest peak in the record (about 37.5 inches) and what appears to be the shallowest (about 10.5). That shallowest point looks like 2025-26, at an ONI of about -0.4. By the ±0.5 threshold used in the figures, it counts as neutral, even though the winter began under a weak La Niña.
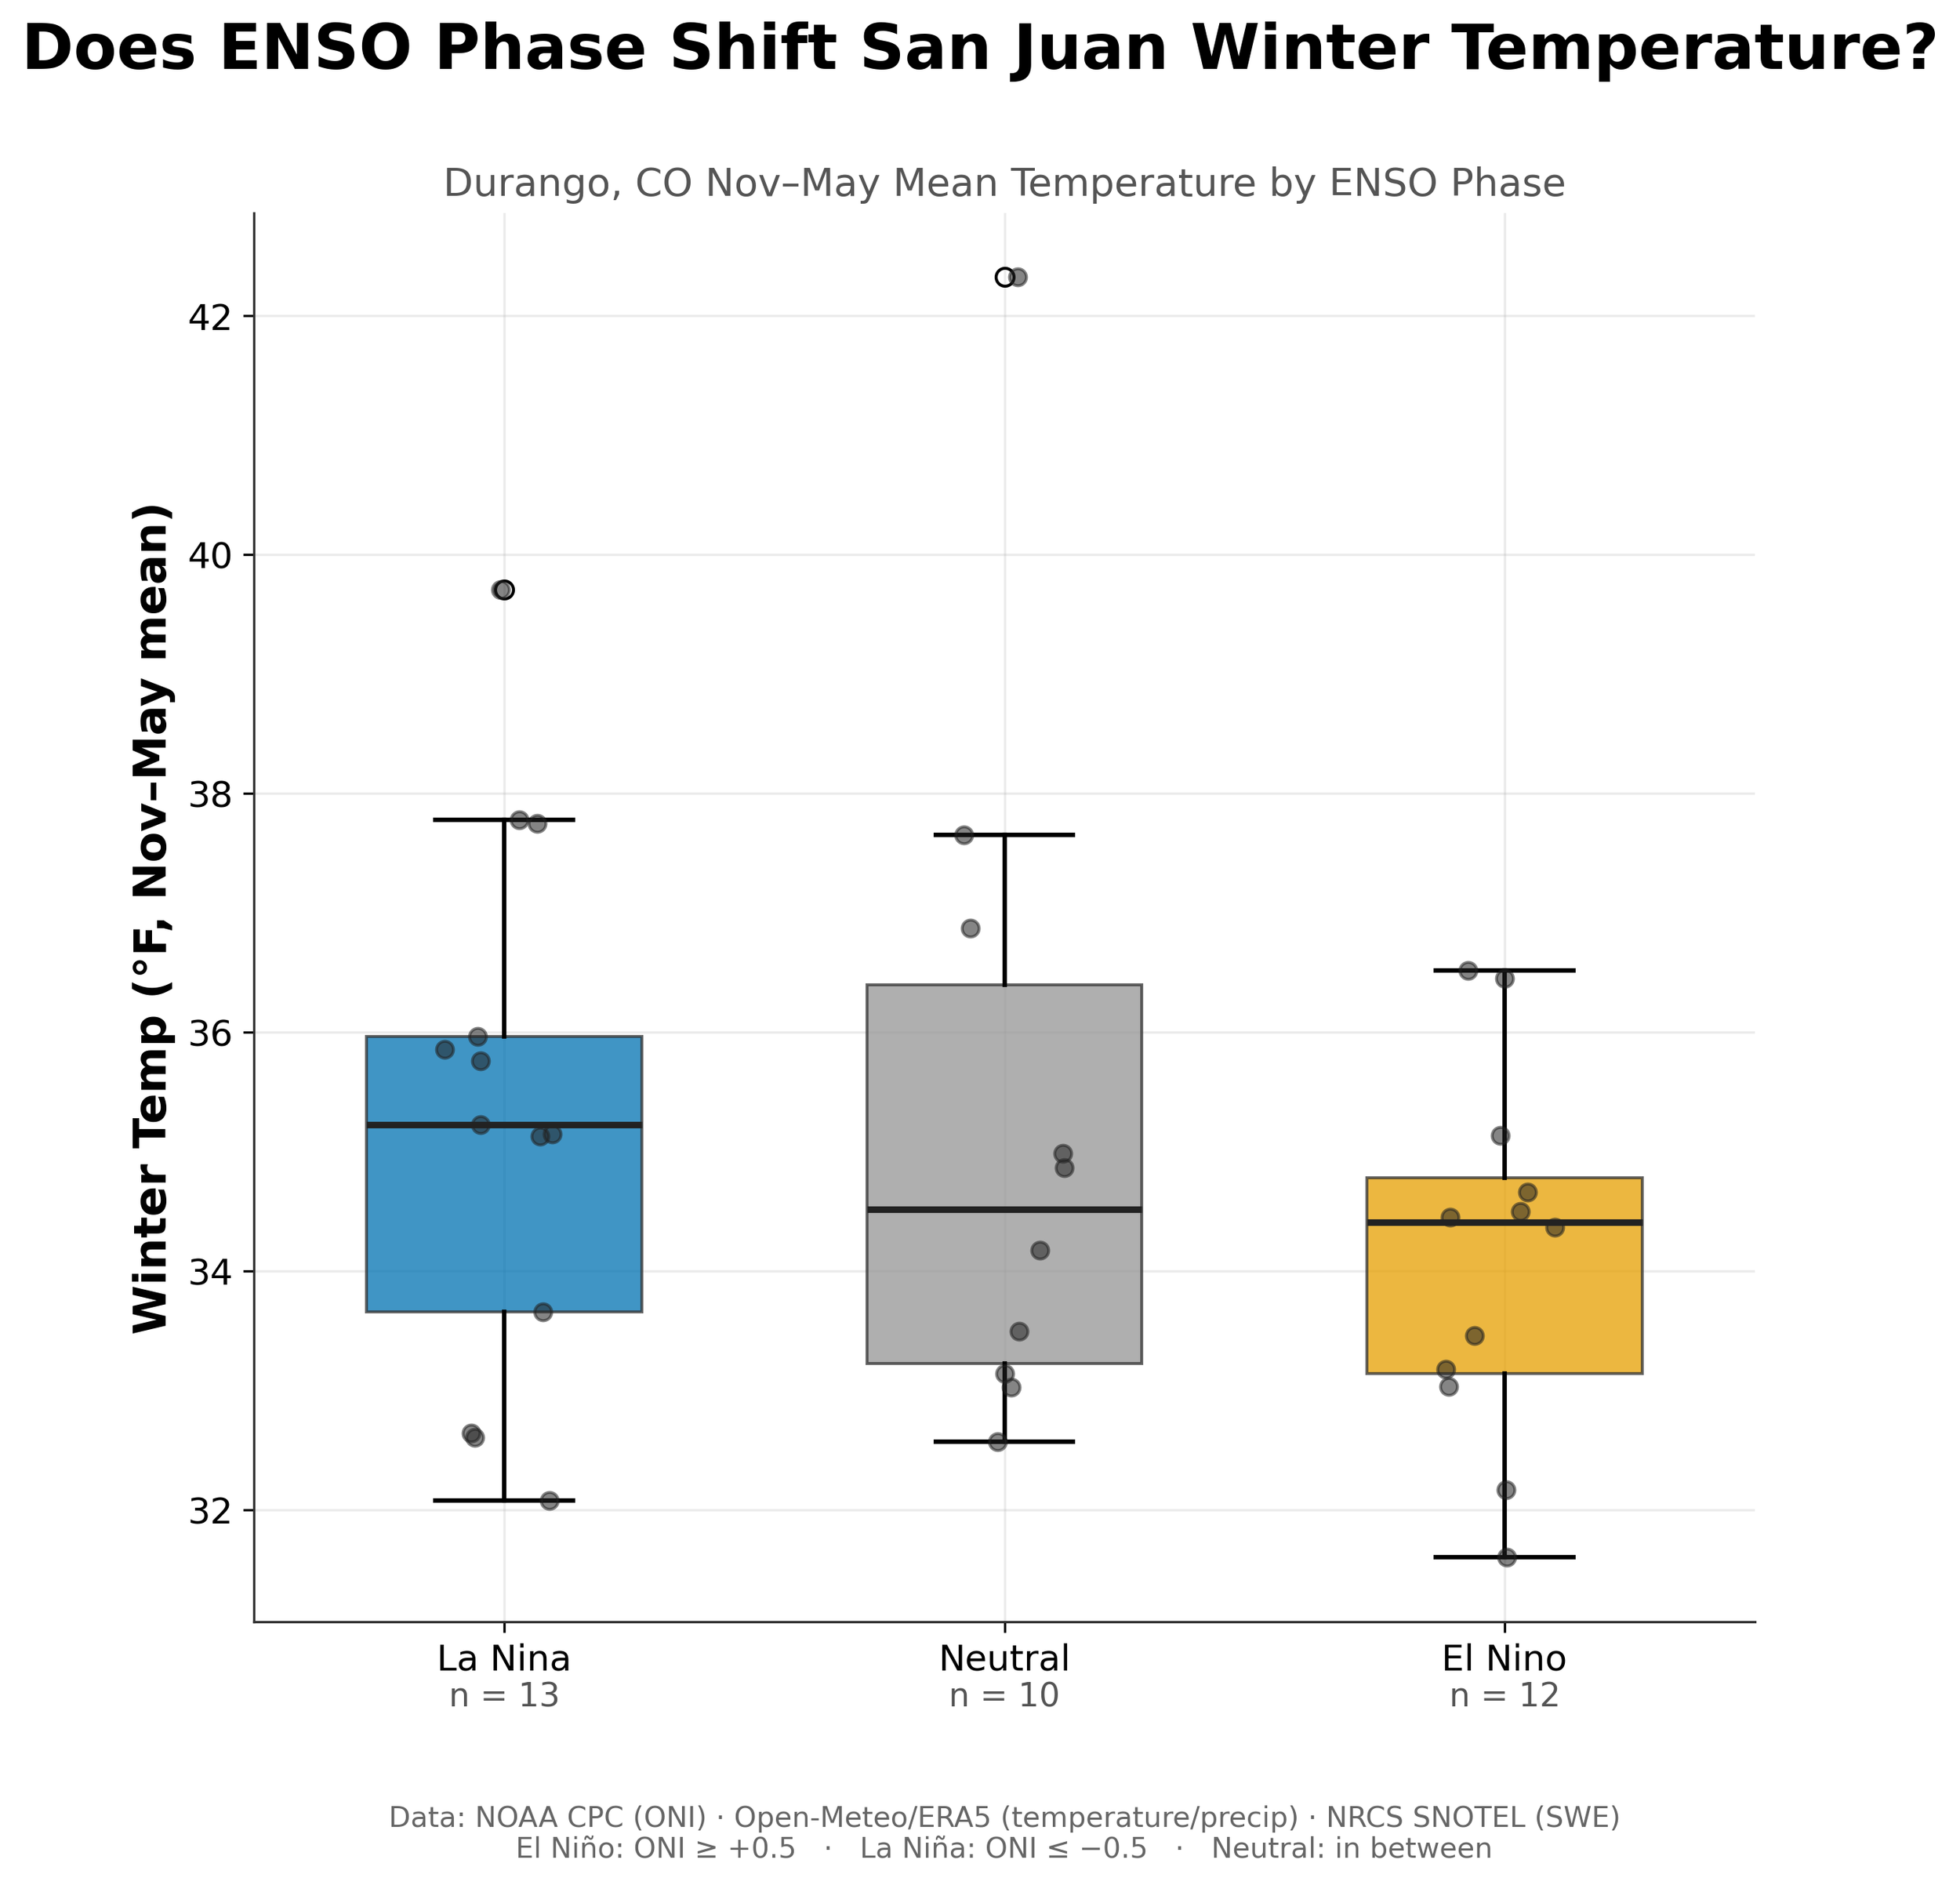
Durango's November-to-May mean temperature, grouped by ENSO phase. El Niño winters ran slightly cooler (median about 34.4°F versus 35.2°F for La Niña), but the boxes overlap heavily. The outlier near 42°F is 2025-26.
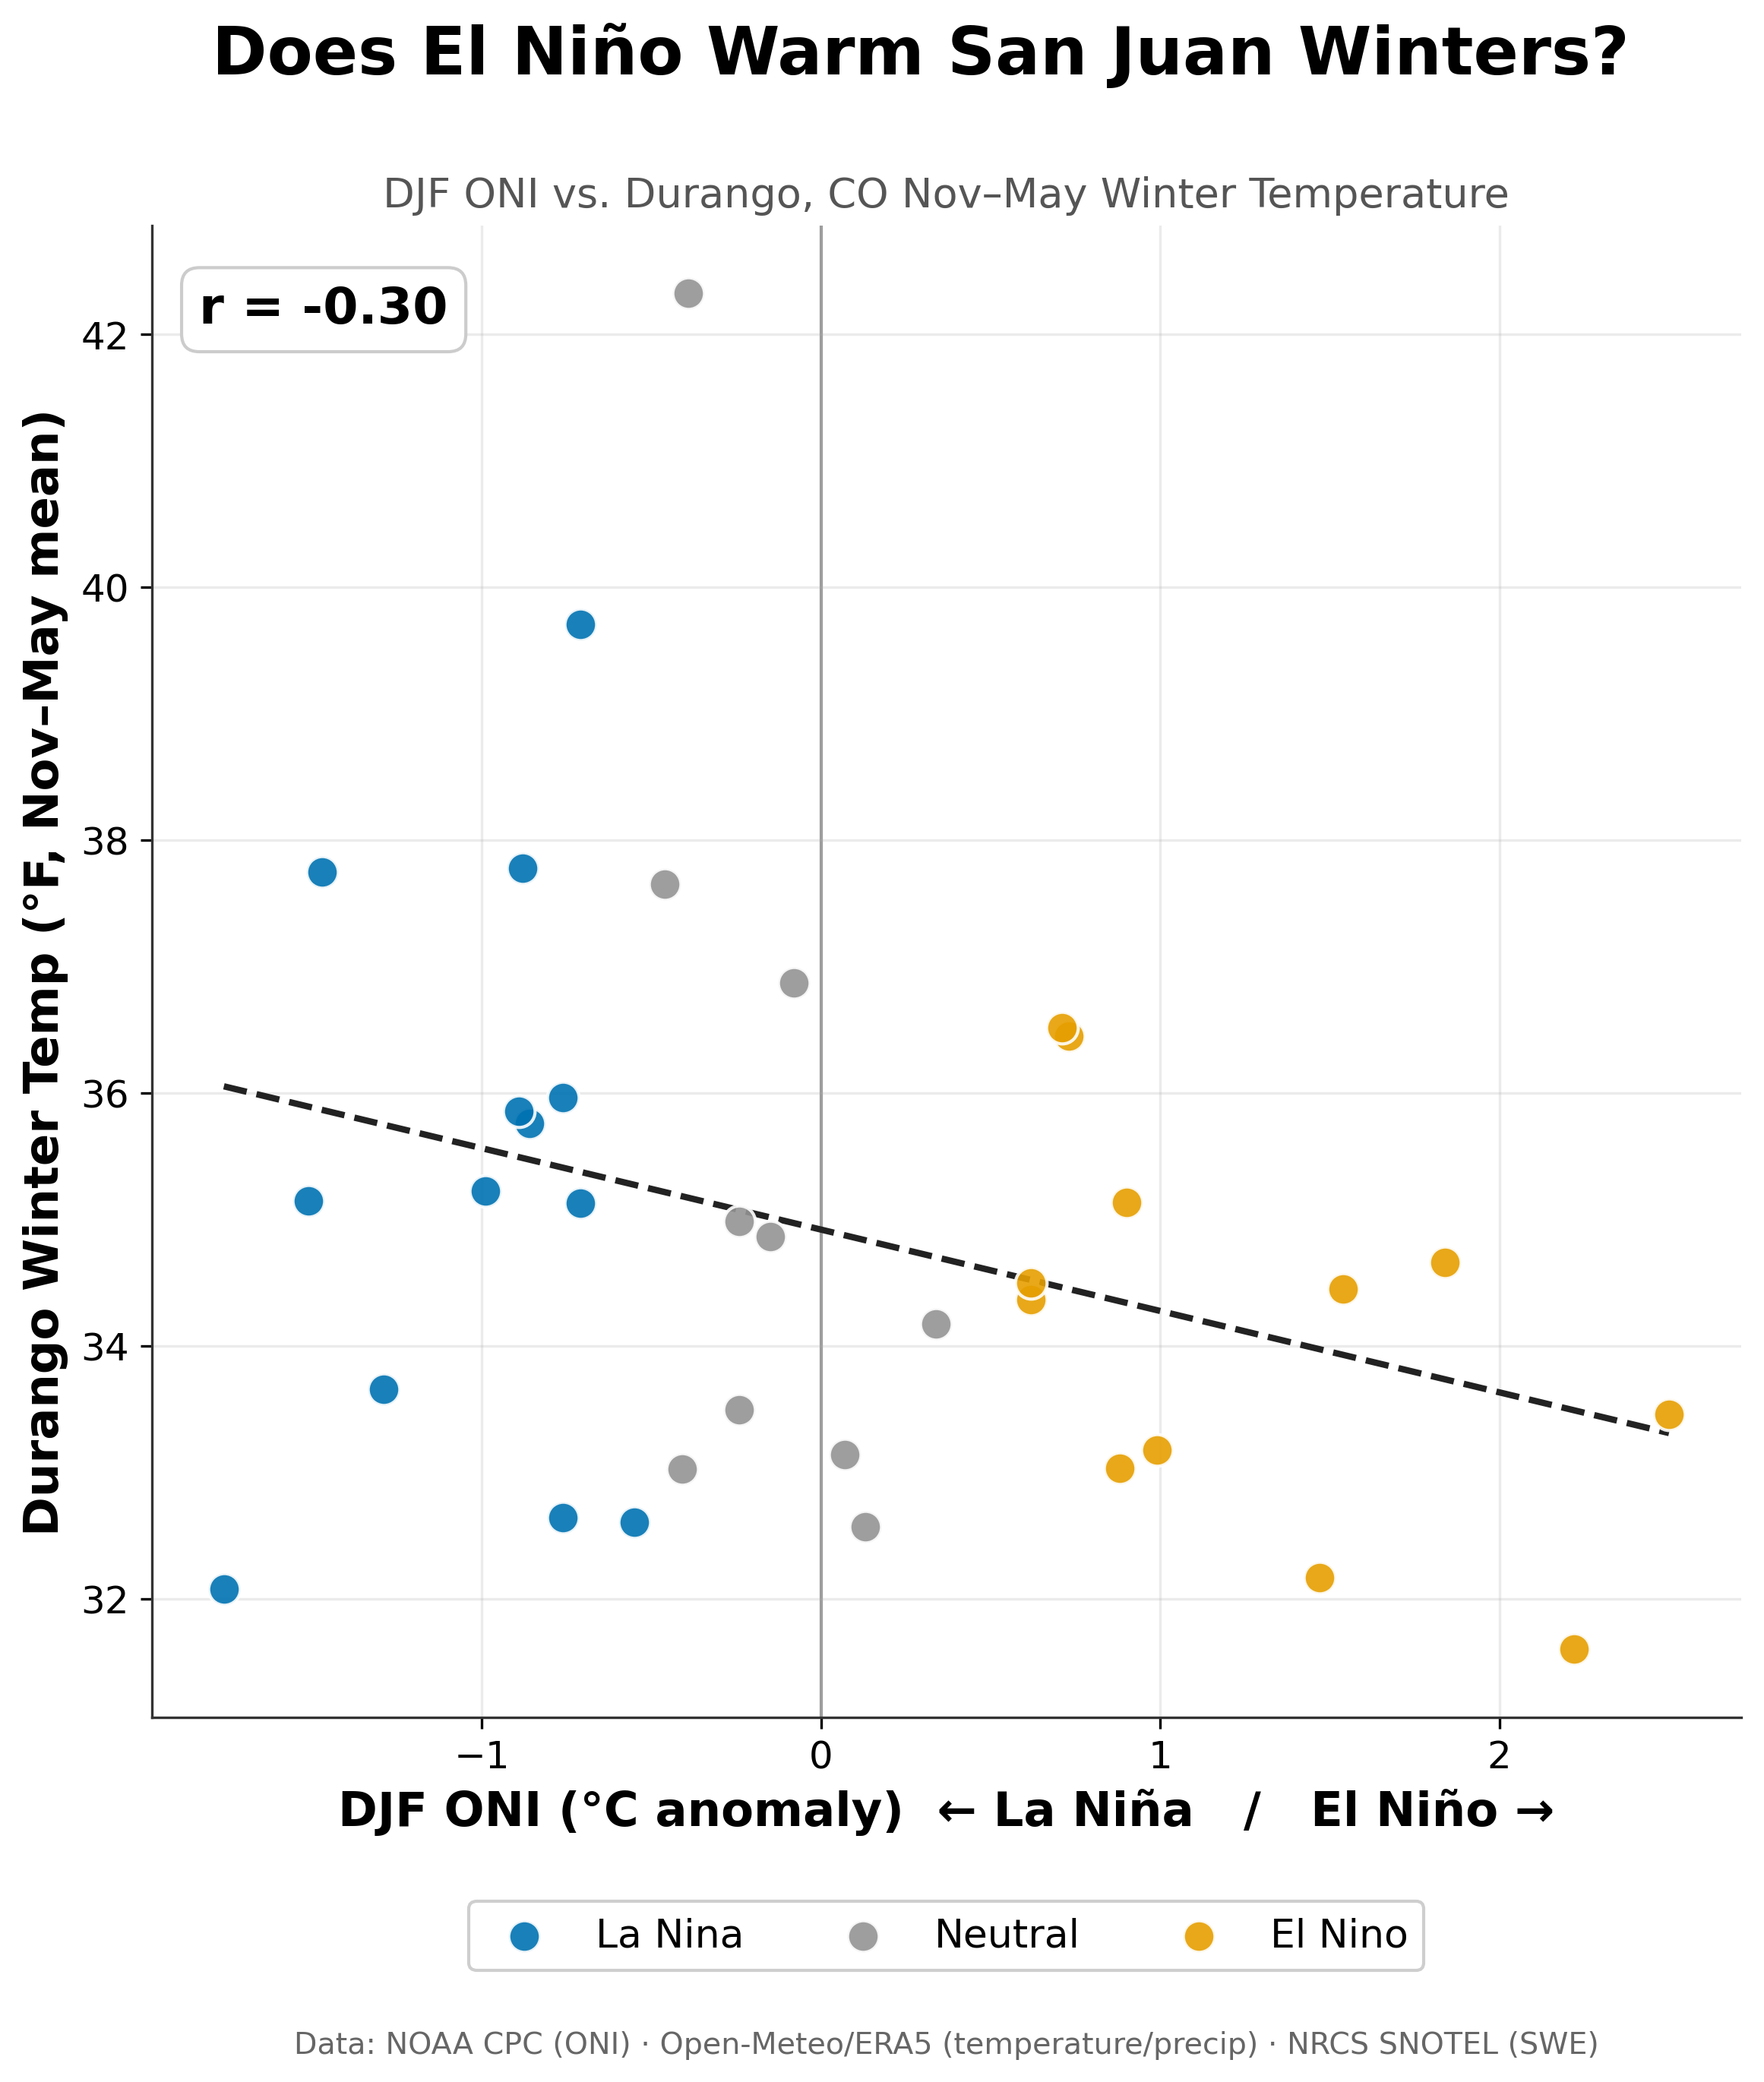
The same temperature record plotted against the ENSO index itself. The trend slopes slightly downward (r = -0.30): El Niño leans cooler in the San Juans, the opposite of the Pacific Northwest. Most of the year-to-year variation is left unexplained.
Temperature is where a faint signal shows up. Durango's November-to-May median is about 35.2°F in La Niña winters, 34.5°F in neutral winters, and 34.4°F in El Niño winters. The boxes overlap heavily, and the spread inside each group, several degrees, is larger than the gap between groups.
Plotted against the ONI itself, the correlation is -0.30: El Niño leans cooler and La Niña leans warmer. With 35 winters, that is suggestive but short of conventional statistical significance (p ≈ 0.08). The sign is the opposite of what the Cascades showed (+0.49), and it matches the textbook southern-tier pattern of cooler winters under El Niño.
Important Limitations
SNOTEL coverage in New Mexico and Arizona was sparse compared to the San Juan. The seven SNOTEL stations lean toward the Silverton, Colorado, and may only partially reflect how the rest of the Southwest behaves.
Durango sits at roughly 6,500 feet, thousands of feet below the stations. Valley temperatures describe the valley, not conditions at ski-area elevation. On inversion days the valley can run colder than the mountains above it. I used a valley point because seasonal temperature anomalies tend to be coherent over long distances, so a warm winter in Durango is usually a warm winter in Silverton. Choosing a valley location also keeps the four regions in this series comparable.
Summary
This past season brought roughly half as much precipitation as 2022-23. A warm air column that appears to have favored rain early and a fast melt rate. The peak arrived a month ahead of schedule at less than half the typical depth. ENSO has nothing to say about snowpack here, and only a faint tilt toward cooler El Niño winters, which could mean good things this ski season in the Southwest with a Super El Niño forecasted. If El Niño brings cooler temperatures, all the Southwest needs is a favorable storm track.
With four regions now in the series, the pattern is clear. The Cascades are the only place where ENSO showed a strong, physically coherent signal. Everywhere else, winters fell apart for reasons the ONI does not capture, and the reasons differ.
Now that we’ve explored basic ENSO signals in 4 western regions, what does this upcoming ski season look like with a Super El Niño forecasted? We’ll explore that next.
Next up: the super El Niño winters in each of these four regions, and what they might suggest for the winter ahead.
Data: NRCS SNOTEL, Open-Meteo (ERA5 reanalysis and archived GFS forecasts), NOAA CPC Oceanic Niño Index.
