Every bad snow year gets blamed on the same thing: El Niño did or La Niña. Using ENSO as an explanation is tidy, it fits in a headline, and it is usually offered with far more confidence than the underlying relationship actually deserves. This post is the third in a series testing that confidence directly, only this time in the Tahoe basin. I used the same methodology applied previously to northern Utah and the Pacific Northwest Cascades: snow water equivalent and precipitation from NRCS SNOTEL stations, valley temperature and upper-atmosphere conditions from Reno, and 35 years of the Oceanic Niño Index (ONI) run against both.
It turns out Tahoe tells an entirely different story than the other two regions.
The Two Seasons, Side by Side
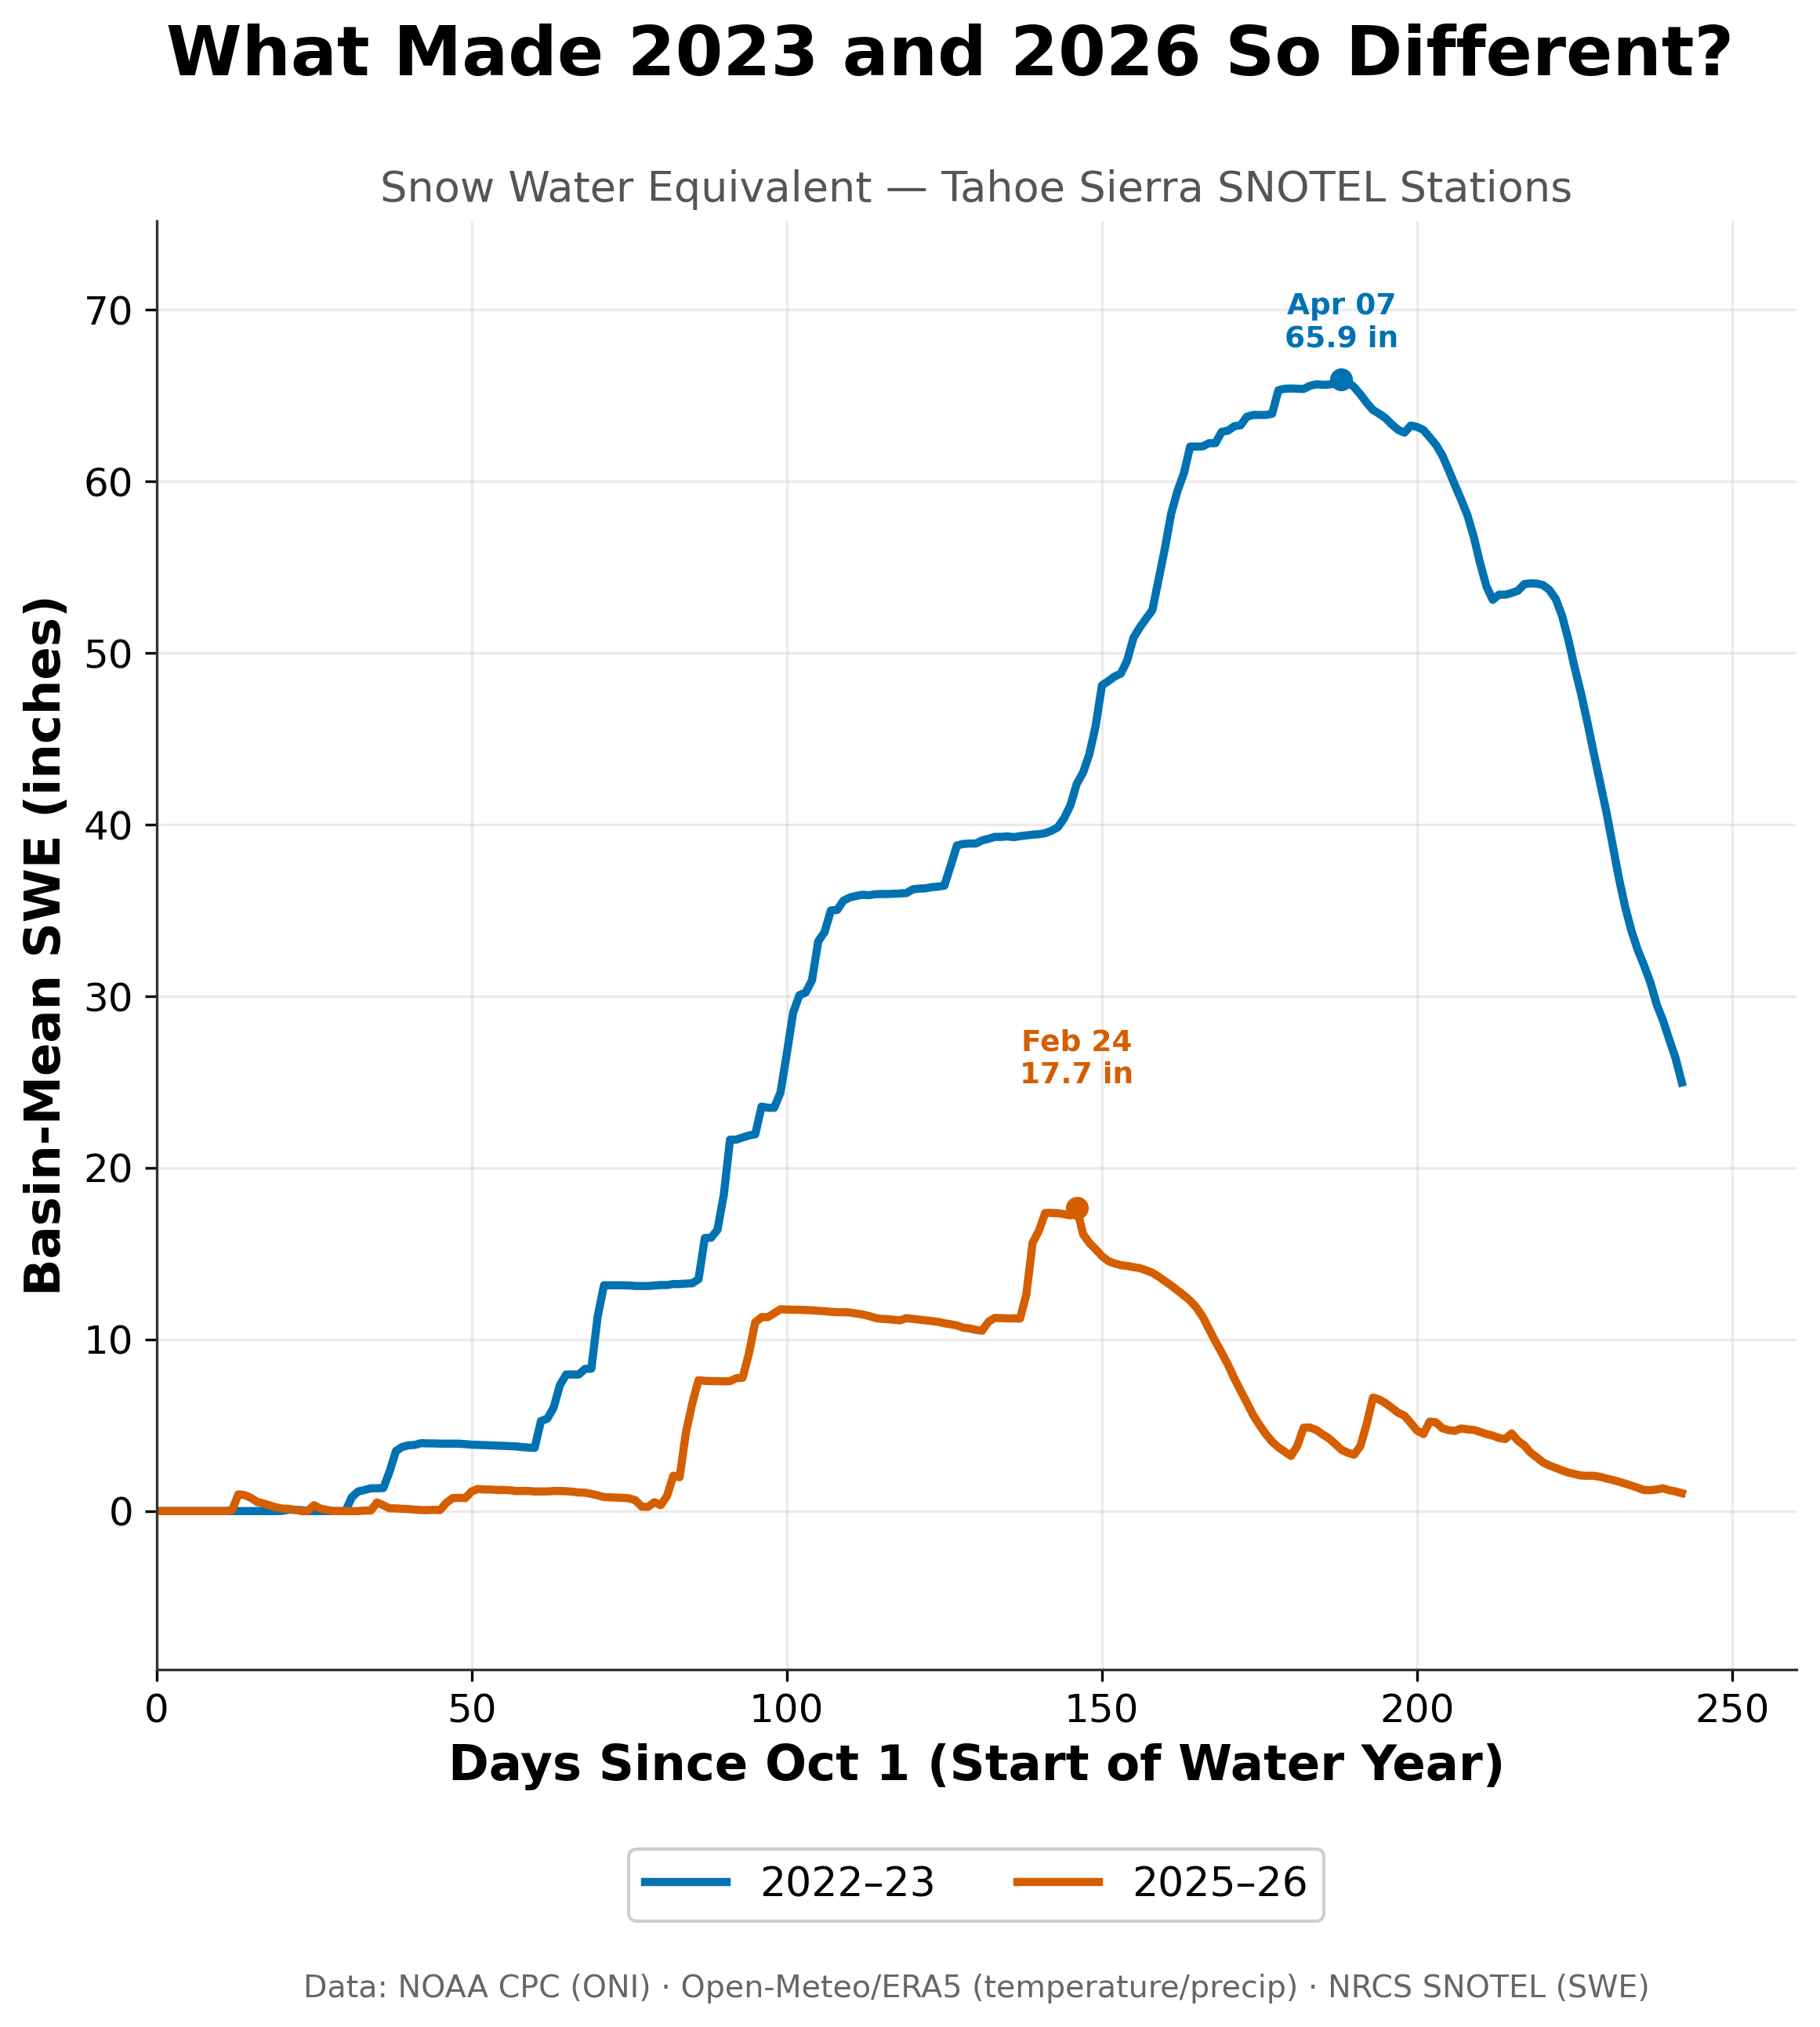
Tahoe's snowpack peaked at about 66 inches on April 7 in 2022-23 (blue). In 2025-26 (red) it topped out near 18 inches on February 24, less than a third as much and almost seven weeks earlier.
The 2022-23 season reached a peak basin-mean SWE of approximately 66 inches on April 7. The 2025-26 season topped out at approximately 18 inches, less than a third of 2022-2023 totals, and did so on February 24, nearly seven weeks earlier. By late spring, 2025-26's snowpack had all but vanished while 2022-23 still had a healthy reserve sitting on the mountain.
In Utah and the Pacific Northwest, the instinct to blame a weak season on a lack of storms turned out to be wrong both times. Precipitation in those two regions between each of the study years was comparable to, or even higher than, the 2022-2023 season. Tahoe had less storms in 2025-2026—period.
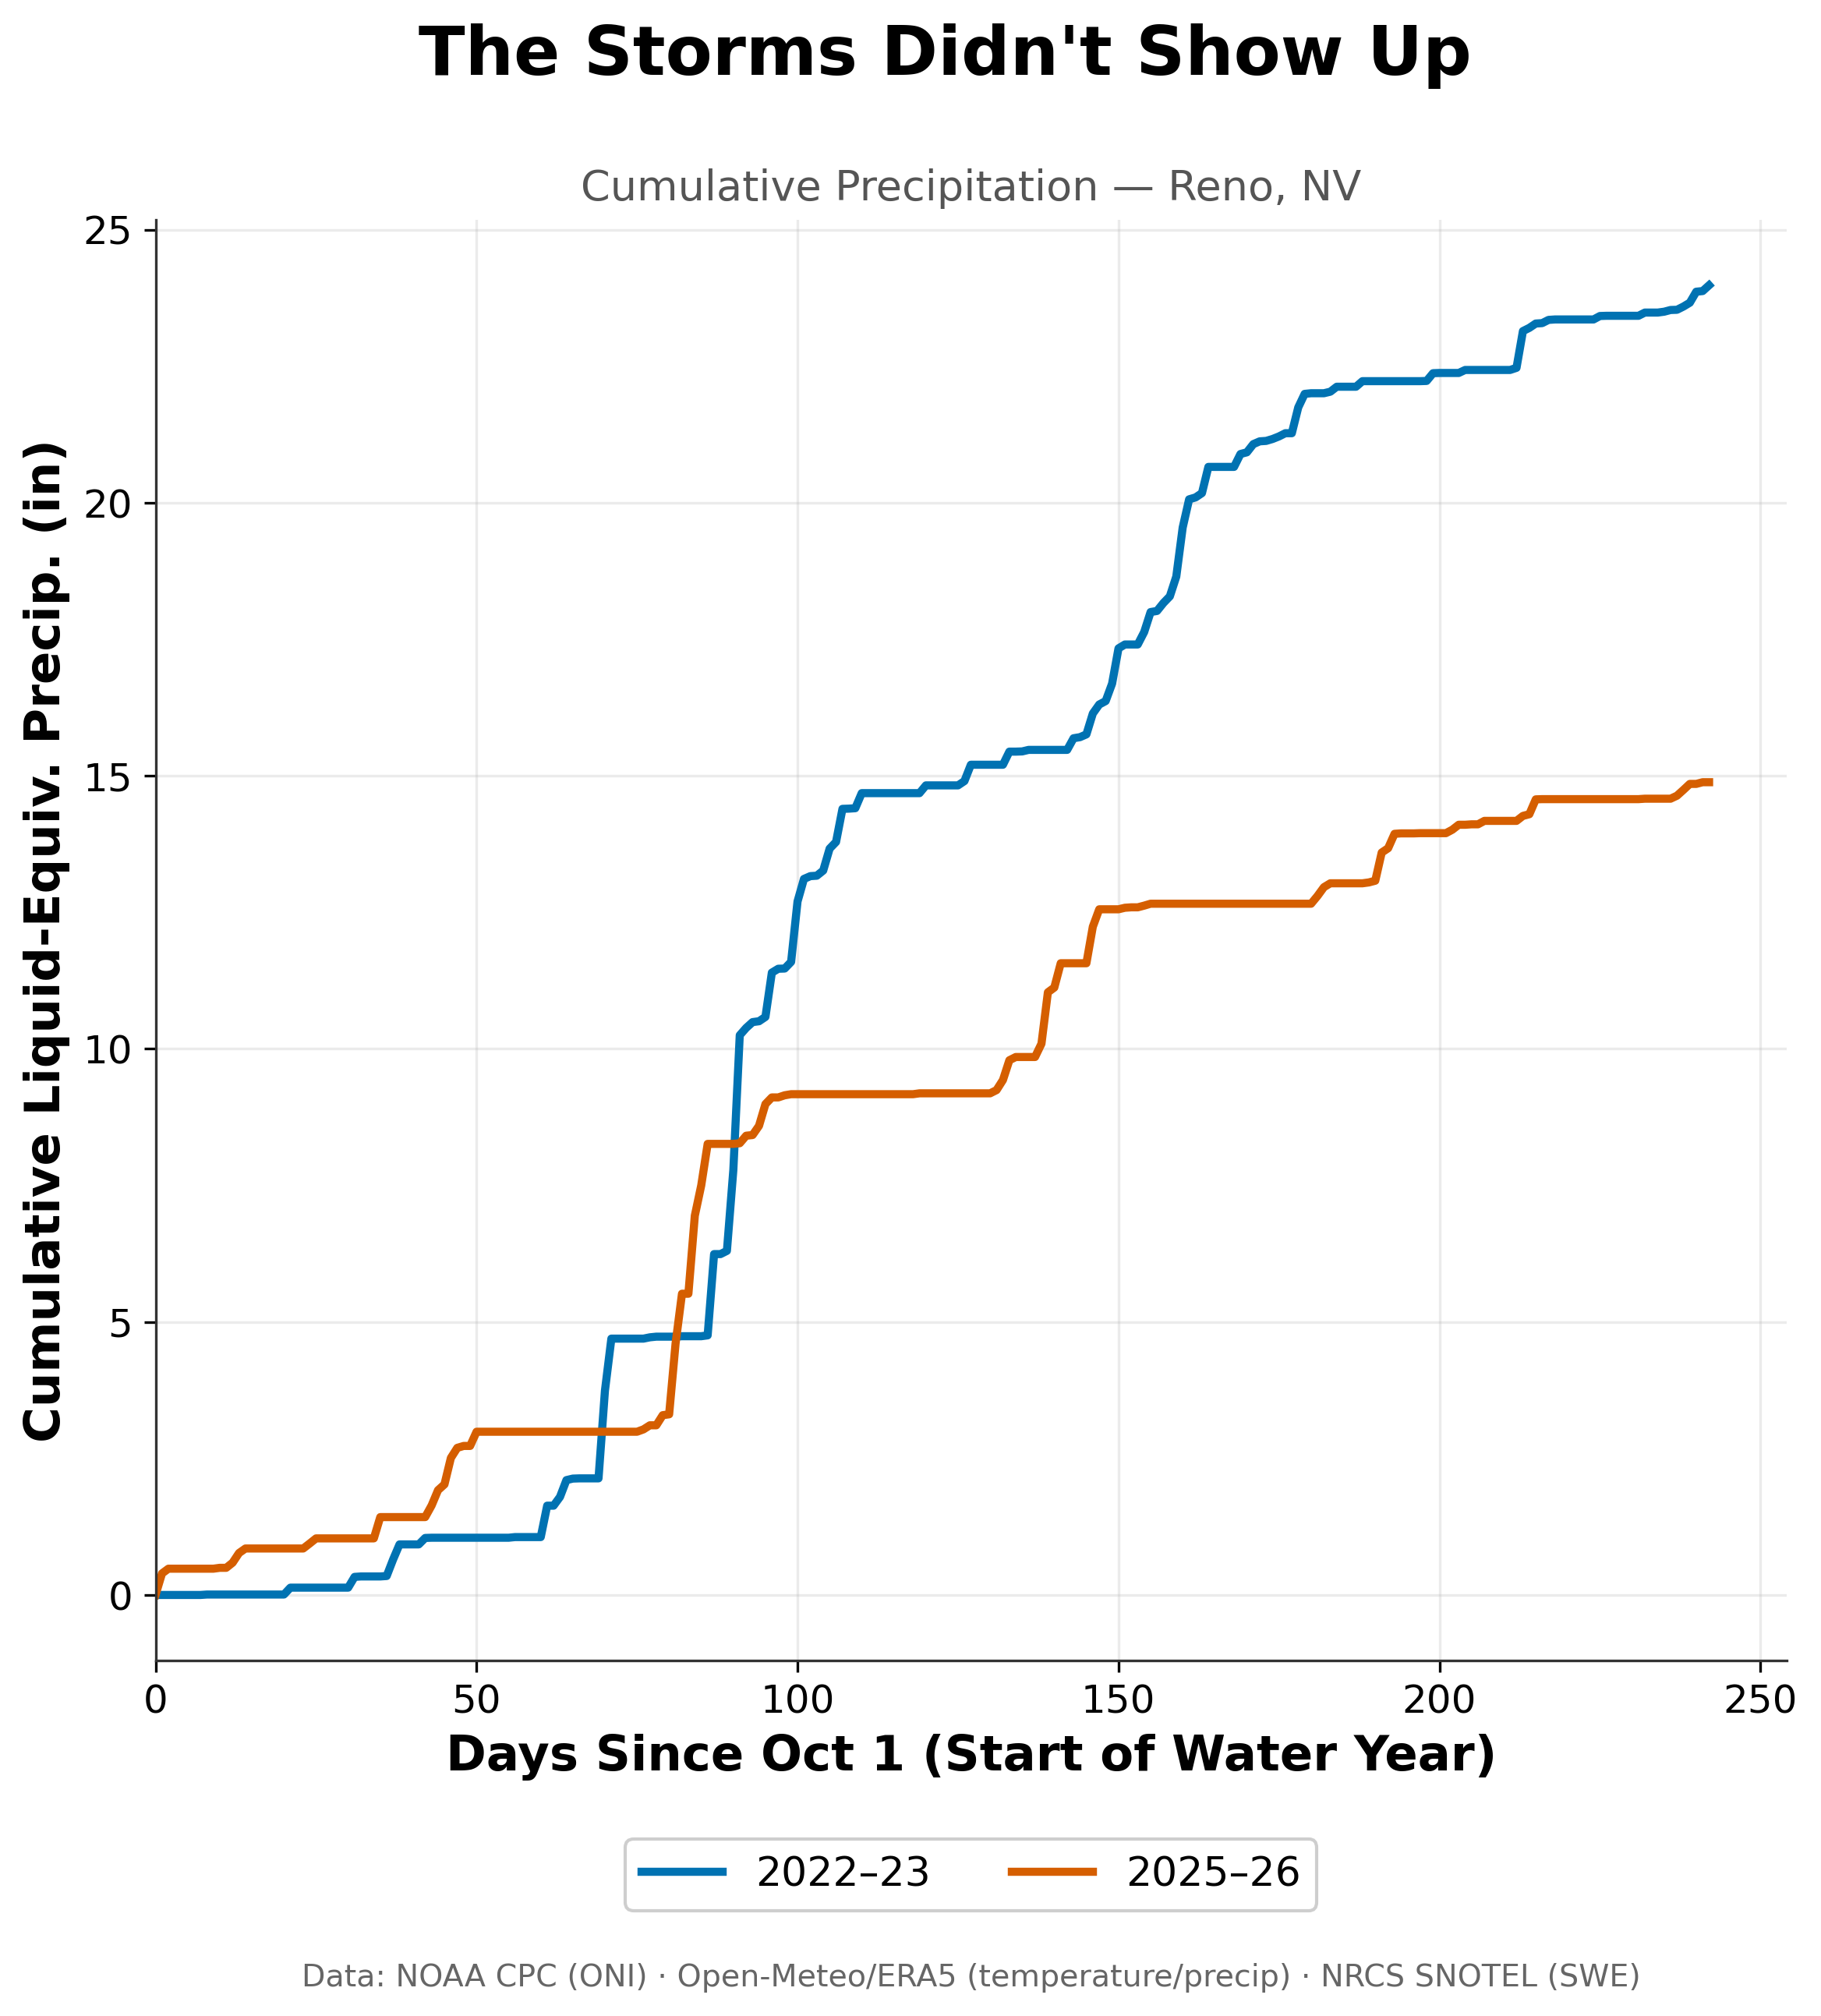
Unlike Utah and the Pacific Northwest, Tahoe's lean year really was a drier one. Reno collected roughly 15 inches of precipitation in 2025-26 (red) compared with about 24 inches in 2022-23 (blue).
Cumulative liquid-equivalent precipitation in Reno came in at roughly 24 inches in 2022-23 and roughly 15 inches in 2025-26, a nearly 40% difference. The storms, this time, actually were fewer and farther between.
But a 40% reduction in precipitation doesn’t fully explain the 70% cut in peak snowpack— something else is at play, too.
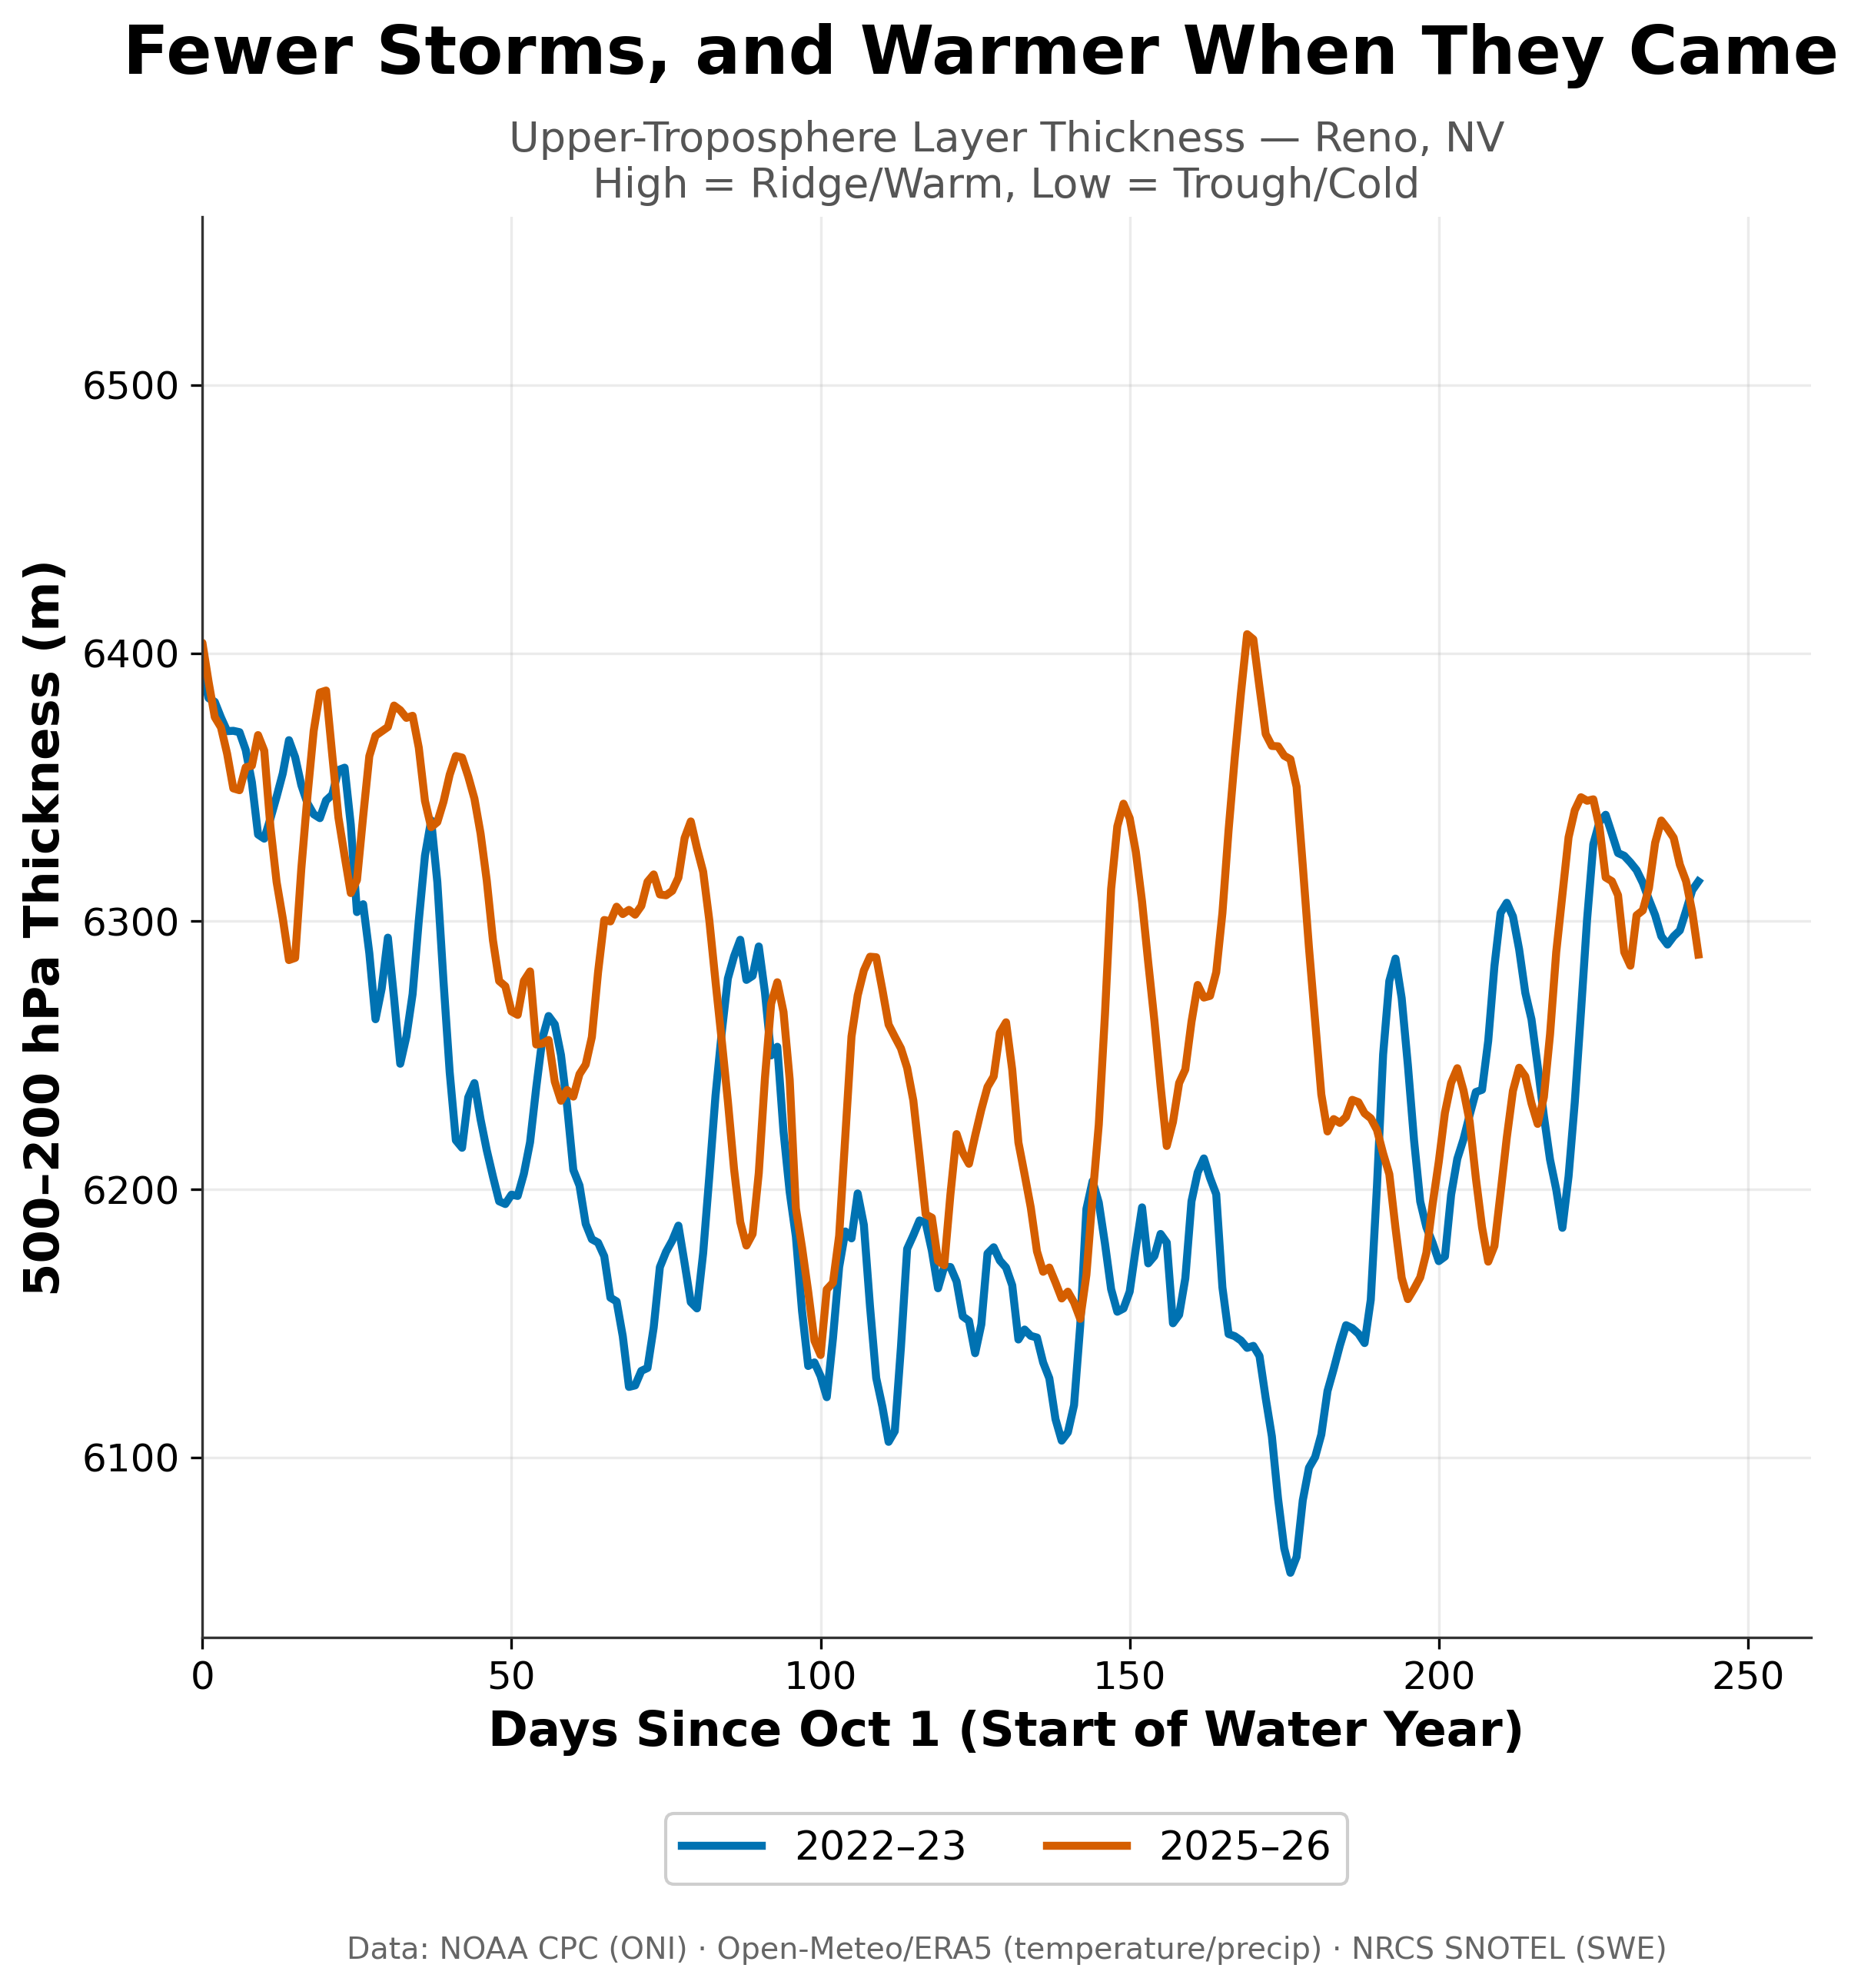
This measures how warm the whole air column was above Reno. Through most of the core winter, 2025-26 (red) ran warmer than 2022-23 (blue), which dug into long, cold troughs that the lean year never matched.
That something else shows up in the thickness of the atmospheric column between 500 hPa and 200 hPa. Thickness is a proxy for temperature of the air was above Reno. For most of the core winter, 2025-26 sat warmer than 2022-23, while 2022-23 dug into a long, cold trough from roughly day 60 through day 180 that this year's winter never matched. Well, it seemed to match inversely. A warmer column of air pushes the rain-snow line higher, therefore making snowfall less likely.
So Tahoe's lean season was not one problem but two, stacked on top of each other: fewer storms, and a warmer atmosphere waiting for the storms that did arrive. That is a different failure mode than Utah, where the storms showed up fine and temperature alone did the damage, and different again from the Pacific Northwest, where the lean year actually out-precipitated the good one. Three regions, three different reasons for roughly the same disappointing outcome. A bad snow year is not one story repeating itself across the West. It is several different stories that happen to end the same way.
Does ENSO Help Explain Any of This?
The earlier two posts in this series found a weak relationship in Utah and a real, physically sensible one in the Pacific Northwest. Tahoe breaks from both.
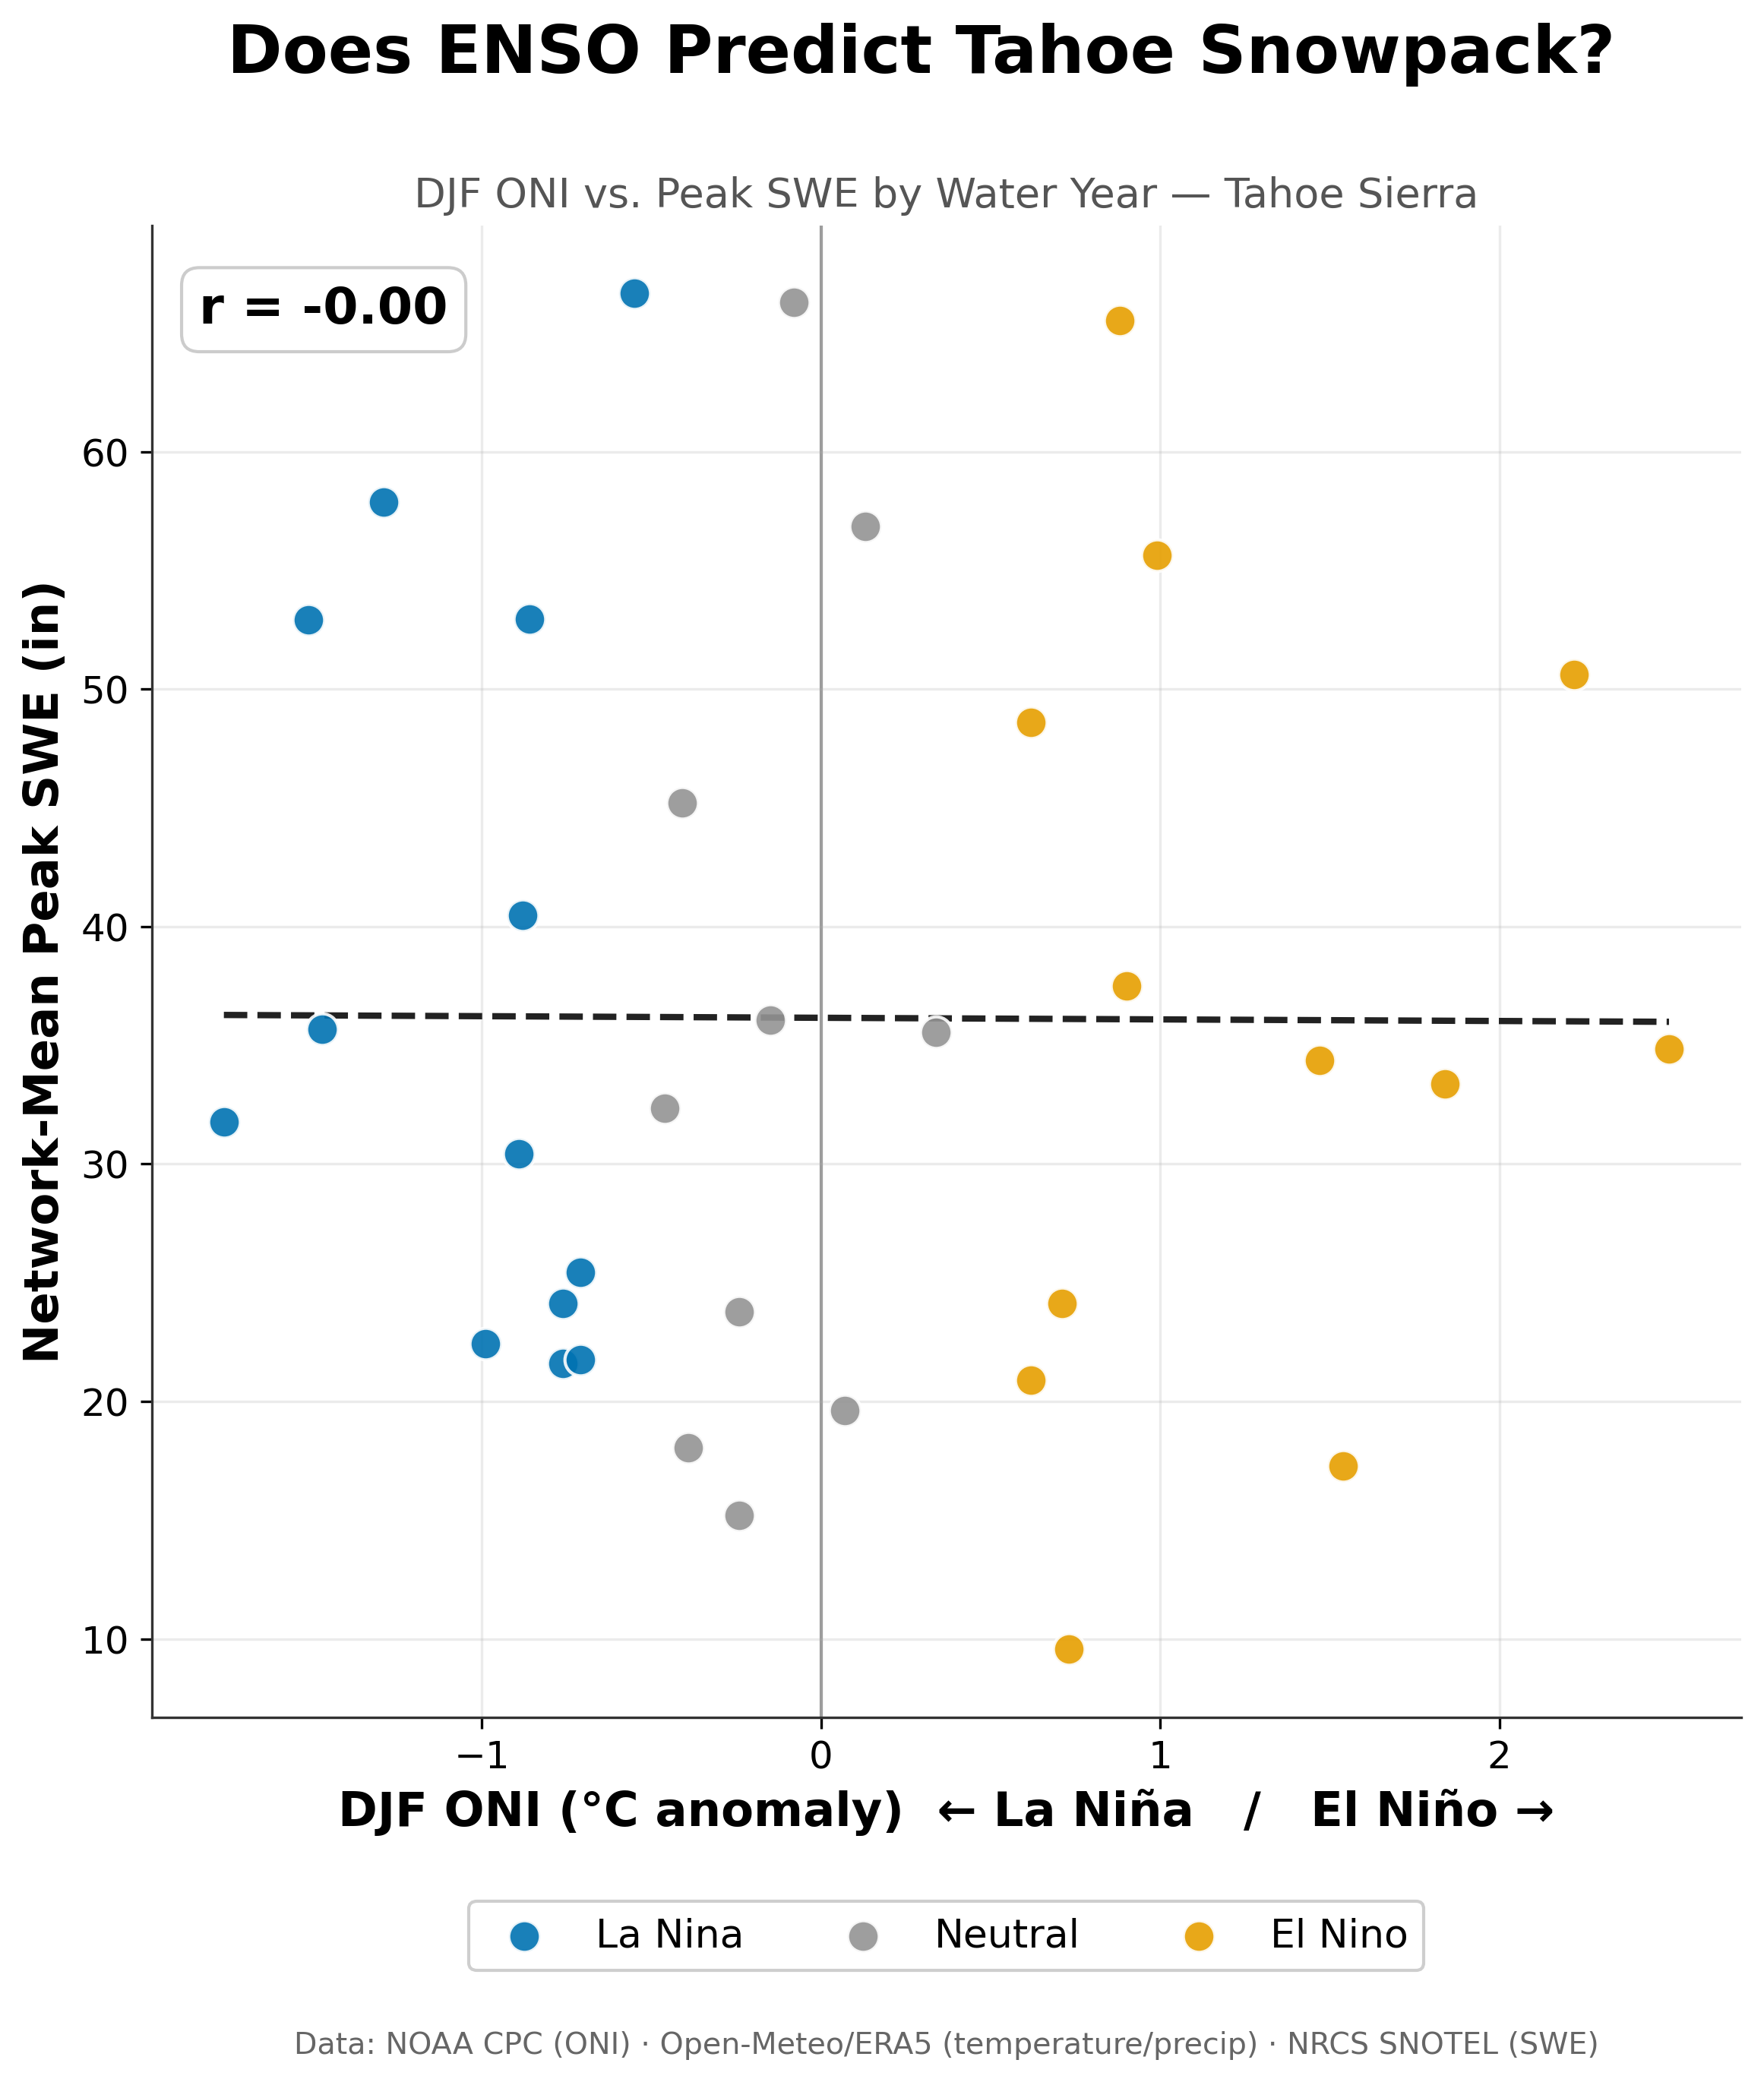
Across 35 winters, El Niño (orange), La Niña (blue), and neutral (gray) years are scattered across the full range of Tahoe snowpack outcomes. The correlation is essentially zero (r = 0.00).
The correlation between winter ONI and peak SWE across 35 water years comes out to approximately 0.00. Not weak. Zero. Strong El Niño winters and strong La Niña winters sit scattered across the full range of snowpack outcomes with no lean toward either side.
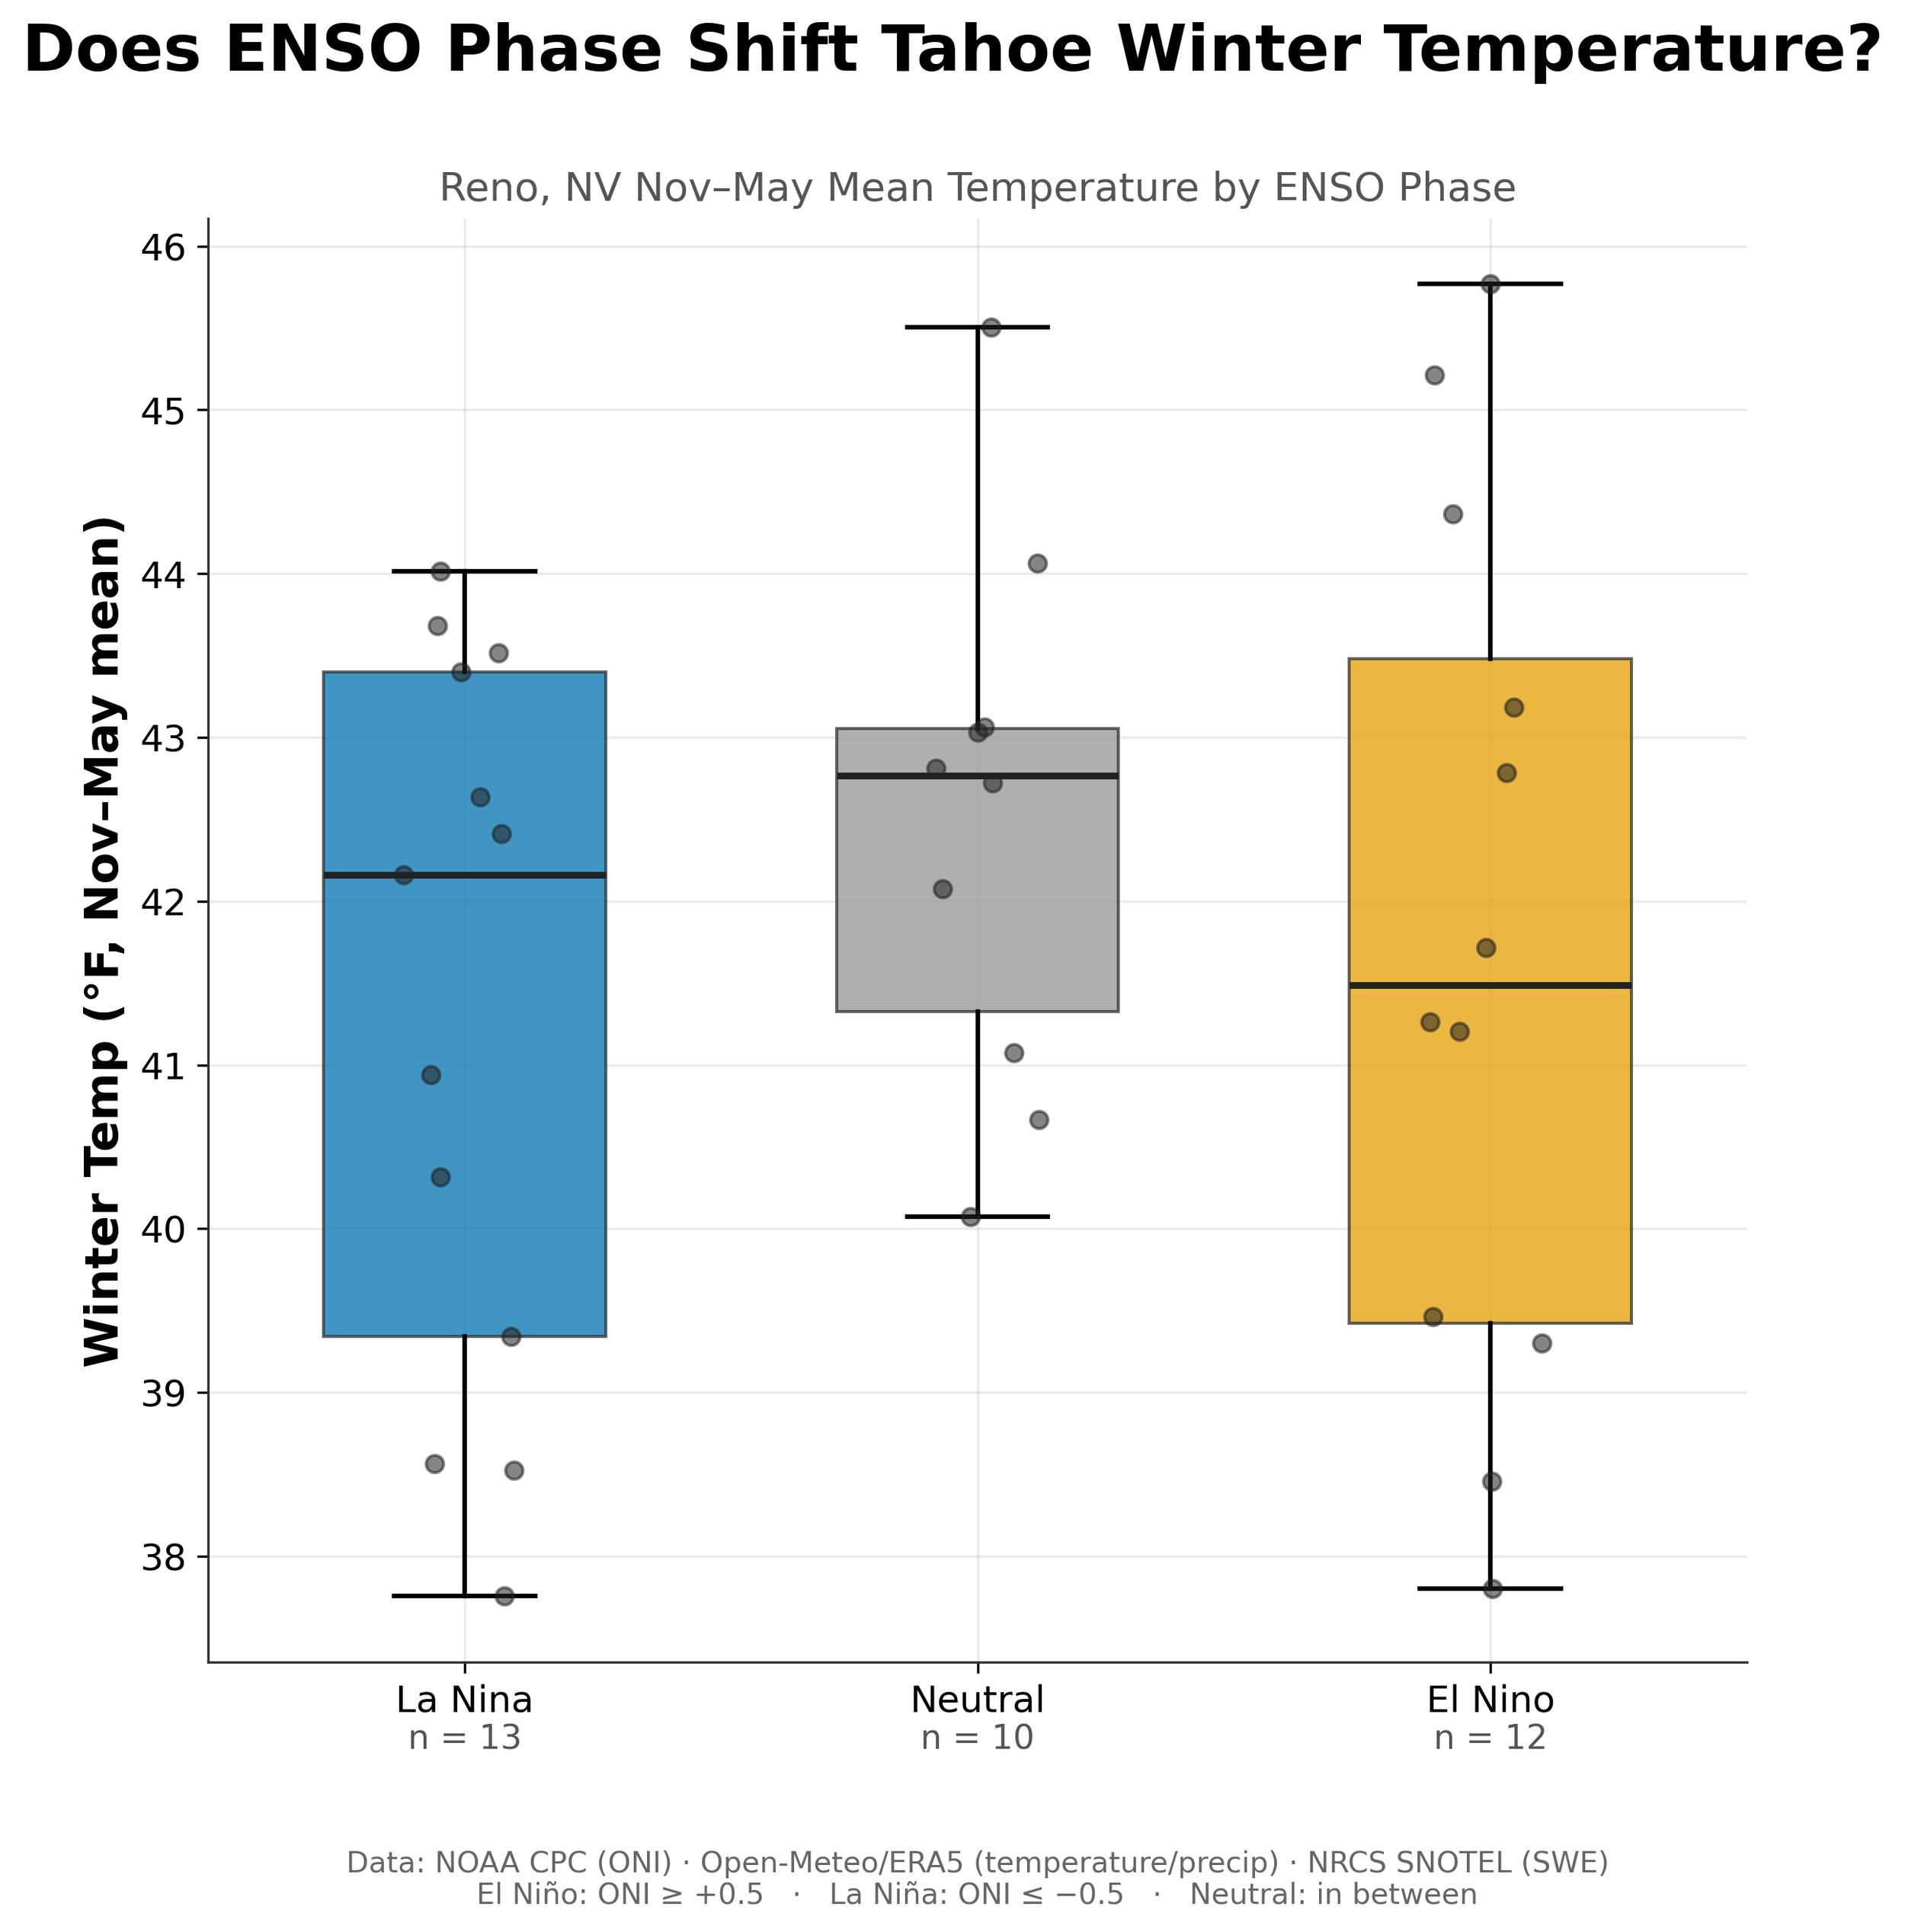
Reno's November-to-May temperatures look nearly the same in La Niña, neutral, and El Niño winters. The medians sit within about a degree of each other, and the spread within each phase is much larger than the gap between them.
Split by ENSO phase, the three temperature distributions sit almost directly on top of each other. If there is a tilt at all, El Niño winters run marginally cooler than La Niña winters here, which is the opposite of what the Pacific Northwest showed.
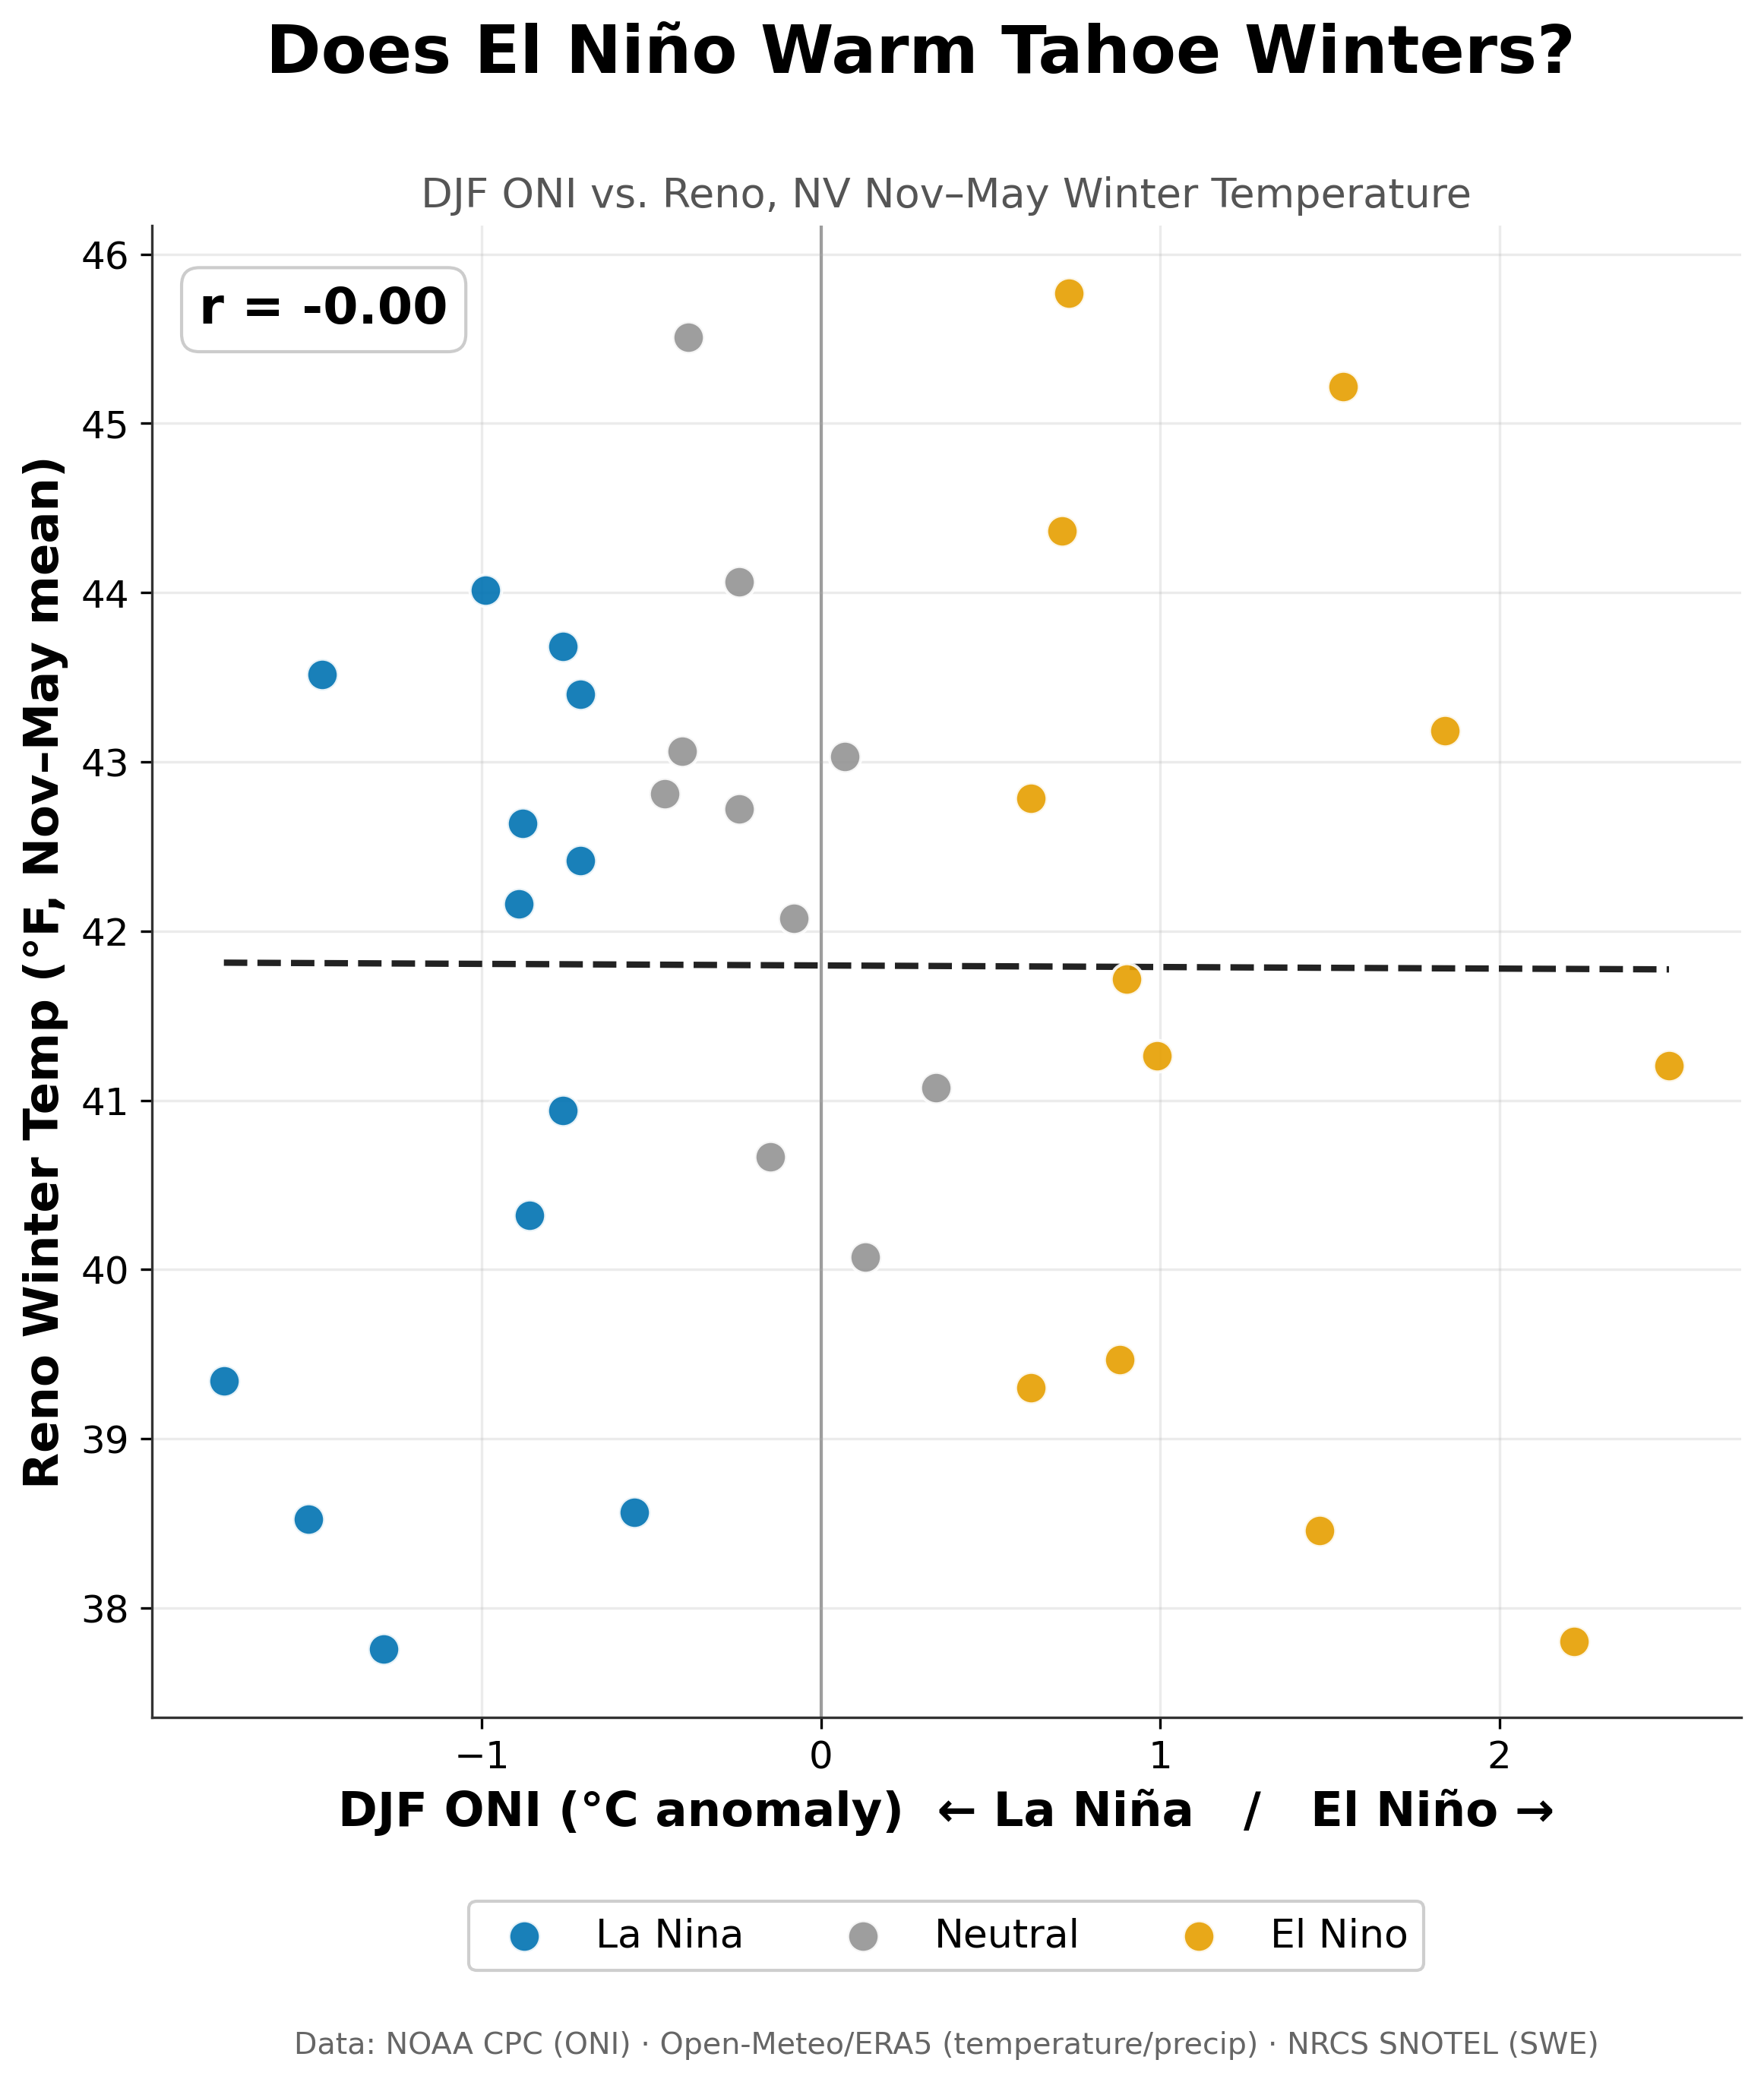
Plotting the ENSO index against Reno winter temperature gives a flat line (r = 0.00). Unlike the Pacific Northwest, where El Niño winters ran reliably warmer, Tahoe shows no relationship here.
Run as a continuous relationship rather than three buckets, ONI and Reno winter temperature correlate at approximately 0.00 as well.
A flat result like this is still worth printing, because it tells you something the headline version of ENSO never will: the strength of the signal moves around a lot by region. Moderate in the Pacific Northwest. Negligible in Utah. Gone in Tahoe. That tracks with where Northern California typically gets placed in the ENSO literature, caught between the Pacific Northwest's La Niña-favored wet pattern and the Southwest's El Niño-favored one. Sit between two competing influences long enough and they tend to cancel each other out rather than add up, and that is close to what these 35 years show.
Important Limitations
The SNOTEL network used here covers the California side of the basin only (Palisades Tahoe, Echo Peak, Heavenly Valley, Independence Lake, Rubicon, Tahoe City Cross, Ward Creek), so the Nevada side, including Mt. Rose and Marlette Lake, is not represented.
Reno sits around 4,500 feet, well below the lake itself at roughly 6,200 feet and lower still than the surrounding resorts. Its temperature record is a reasonable stand-in for the regional airmass, not a direct read on conditions at ski-area elevation.
Thirty-five years is enough to say a strong ENSO relationship is not present here. It is not enough to rule out a small one with any real precision. It is also worth flagging that 2022-23 was an unusually wet winter for California even by California standards, driven by a run of atmospheric rivers rather than a textbook La Niña pattern. Treat it as a representative baseline for a "good year" at your own risk; it may be as much of an outlier as 2025-26 was, just pointed the other direction.
And as always: correlation is not causation, and these are linear correlations, which would miss a relationship that behaves differently at the extremes than it does in the middle.
Summary
Tahoe's lean season was not a repeat of what happened in Utah or the Pacific Northwest. Storms genuinely stayed away more than usual, and the air was warmer when they did show up, and neither factor by itself accounts for how far the snowpack fell short.
ENSO, meanwhile, has nothing to say about any of it here. No relationship with snowpack, no relationship with temperature, across 35 years. That null result fits into a pattern now rather than standing alone: three regions, three very different answers to the same question, which is itself the point.
