What Separated the 2023 and 2026 Ski Seasons in the Pacific Northwest, and What ENSO Had to Do With It
Understanding what drove past ski seasons may help skiers better anticipate how future seasons could unfold. The Cascades produced two very different winters within a few years of each other: 2022-23 delivered a deep, durable snowpack, while 2025-26 left far less snow on the ground despite a winter that felt, to most people in the region, persistently wet. Comparing the conditions that produced those two outcomes, and then placing both within a longer climate record, can help clarify which signals are worth paying attention to before a season begins and which are not.
This post summarizes a small research project that compares snowpack, precipitation, and atmospheric conditions across the 2023 and 2026 seasons in the Washington Cascades, and then tested how strongly the El Niño-Southern Oscillation (ENSO) relates to snowpack and winter temperature across the past 35 years.
The Two Seasons, Side by Side
The most direct measure of a ski season is snow water equivalent, or SWE, which describes how much liquid water is held within the snowpack. SWE is generally a more reliable indicator of snowpack condition than snow depth, because it is unaffected by how much the snow has settled or compacted over time.
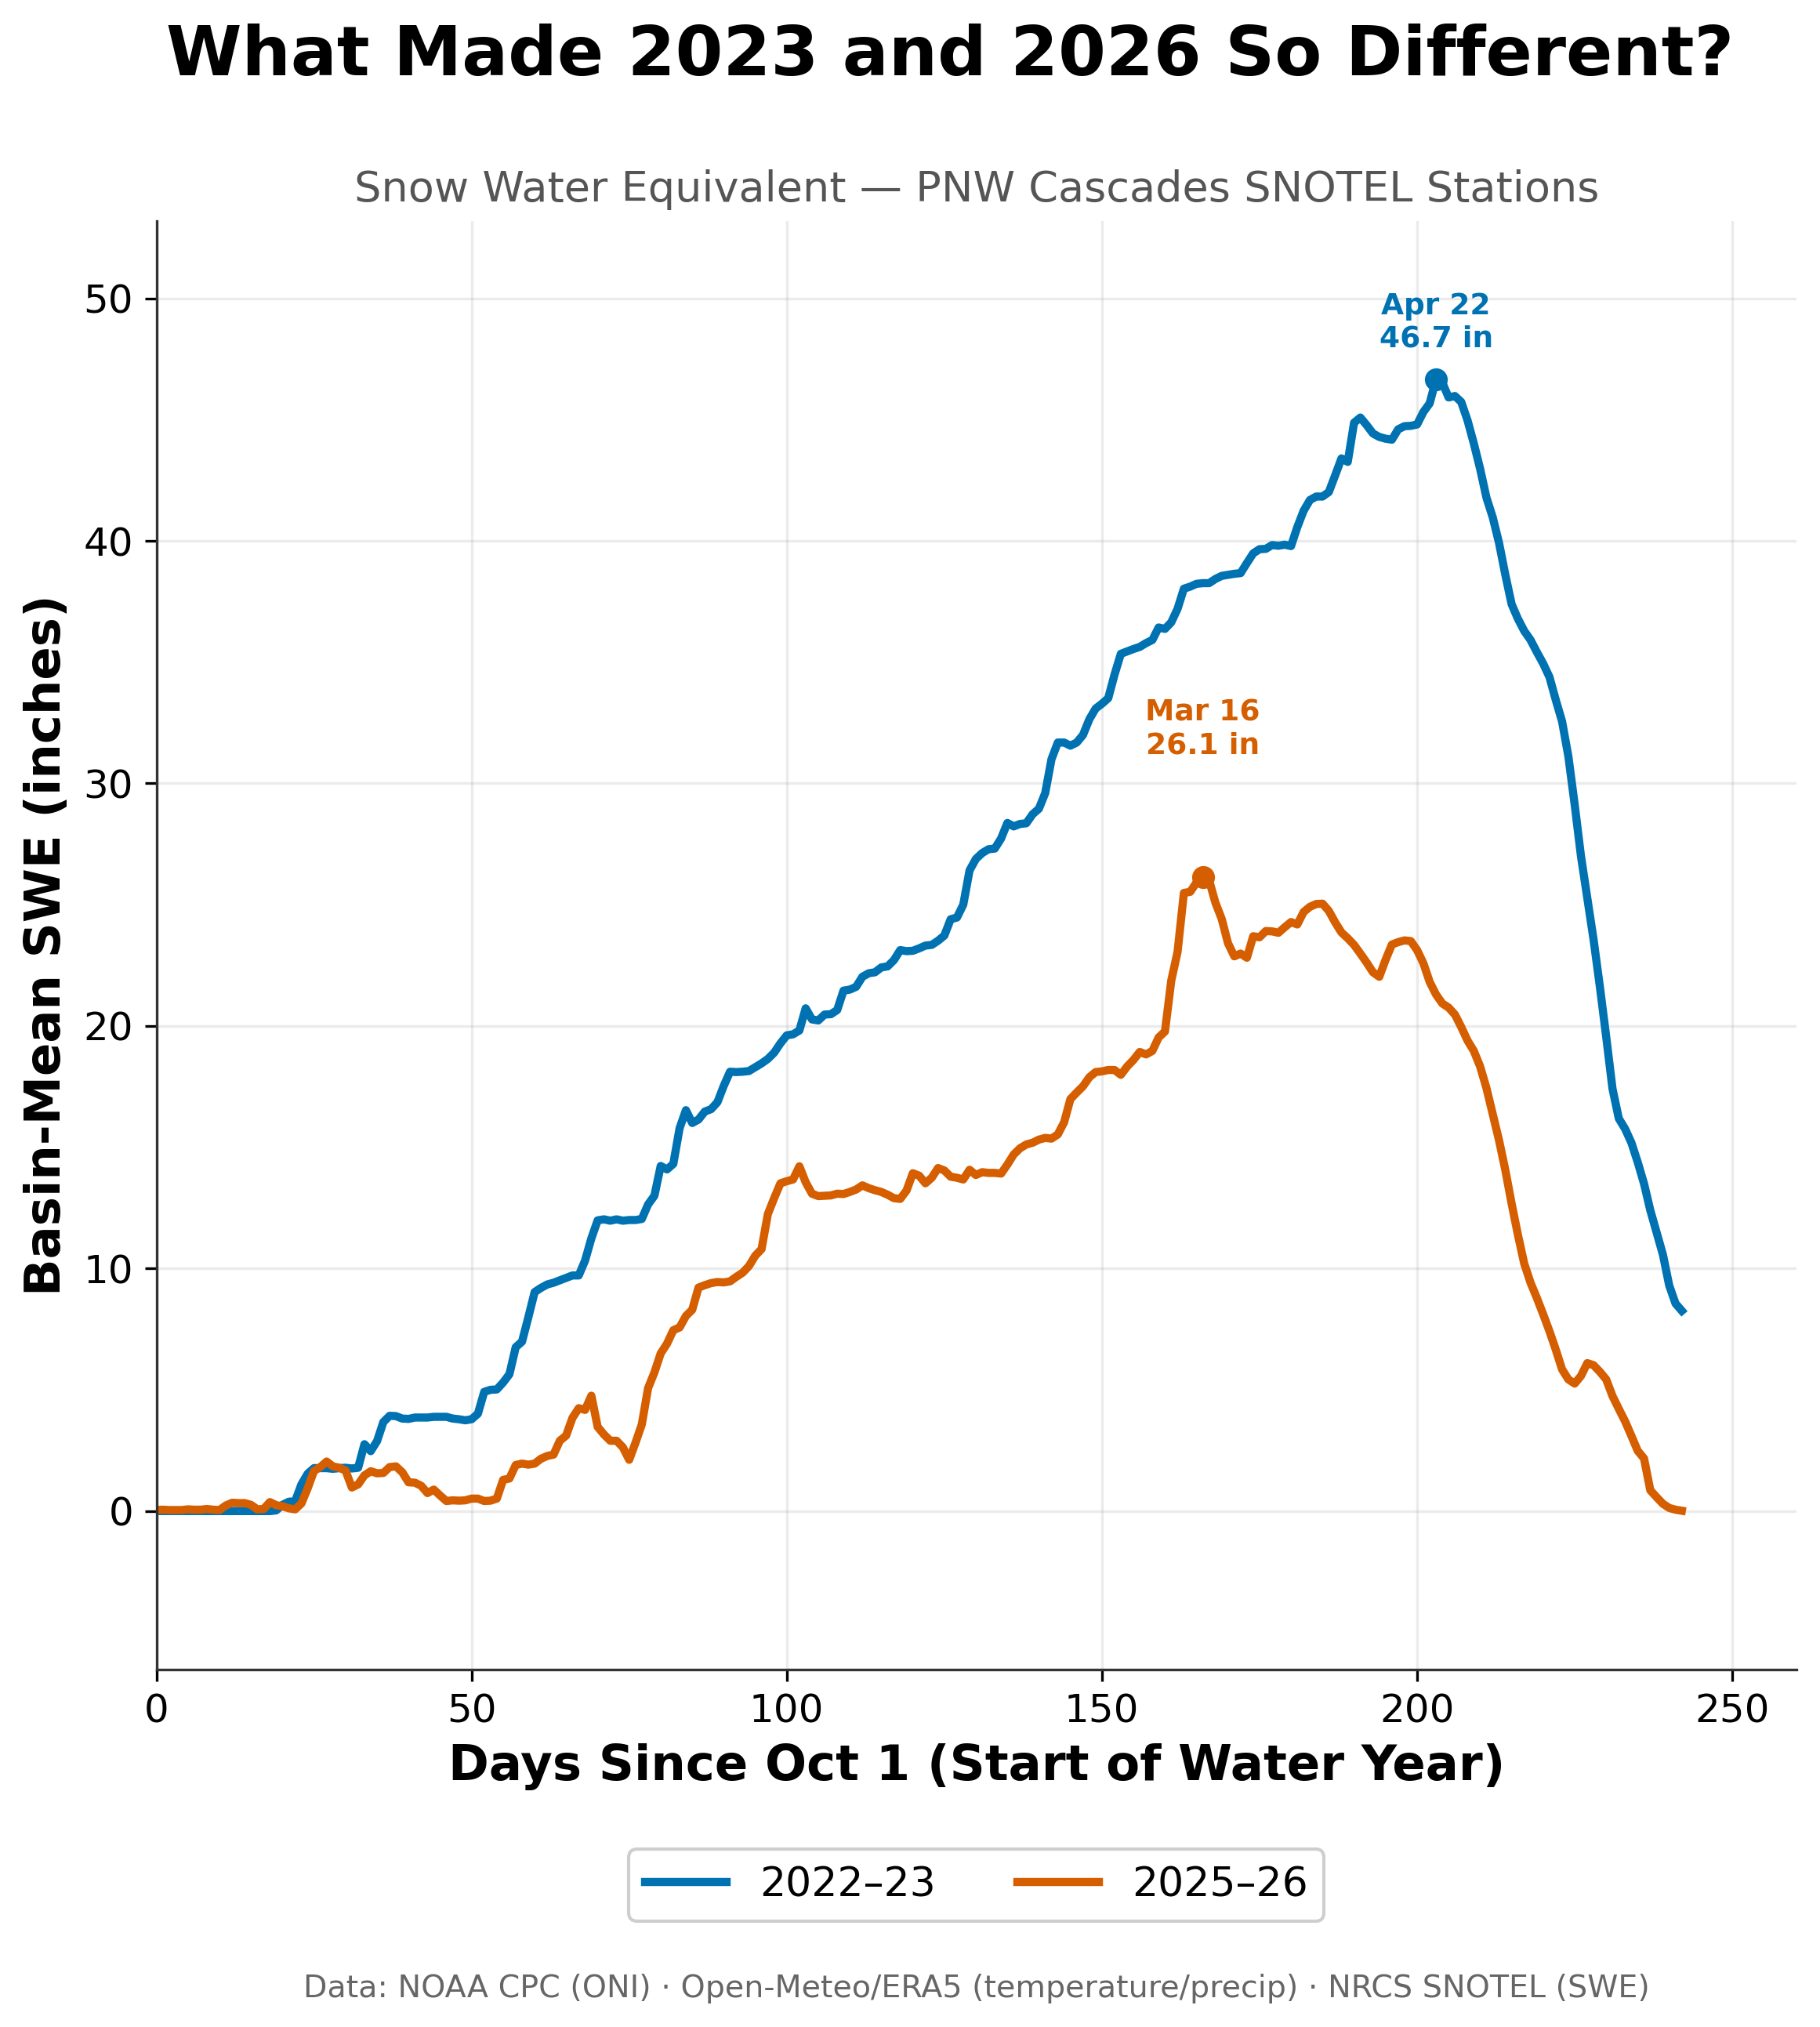
FIGURE 1: Snowpack in the Cascades peaked at 46.7 inches on April 22 in 2022-23 (blue) — nearly double the 26.1 inches 2025-26 (red) managed by its March 16 peak.
The difference between the two seasons is substantial. The 2022-23 season accumulated roughly twice the peak SWE of 2025-26, and it also held its snowpack later into the spring. The 2025-26 season not only peaked lower, it peaked earlier, which meant that the snowpack began declining while a meaningful portion of the ski season still remained.
A reasonable first assumption would be that 2025-26 was simply a drier winter, and that fewer storms reached the region. The precipitation record does not support that explanation.
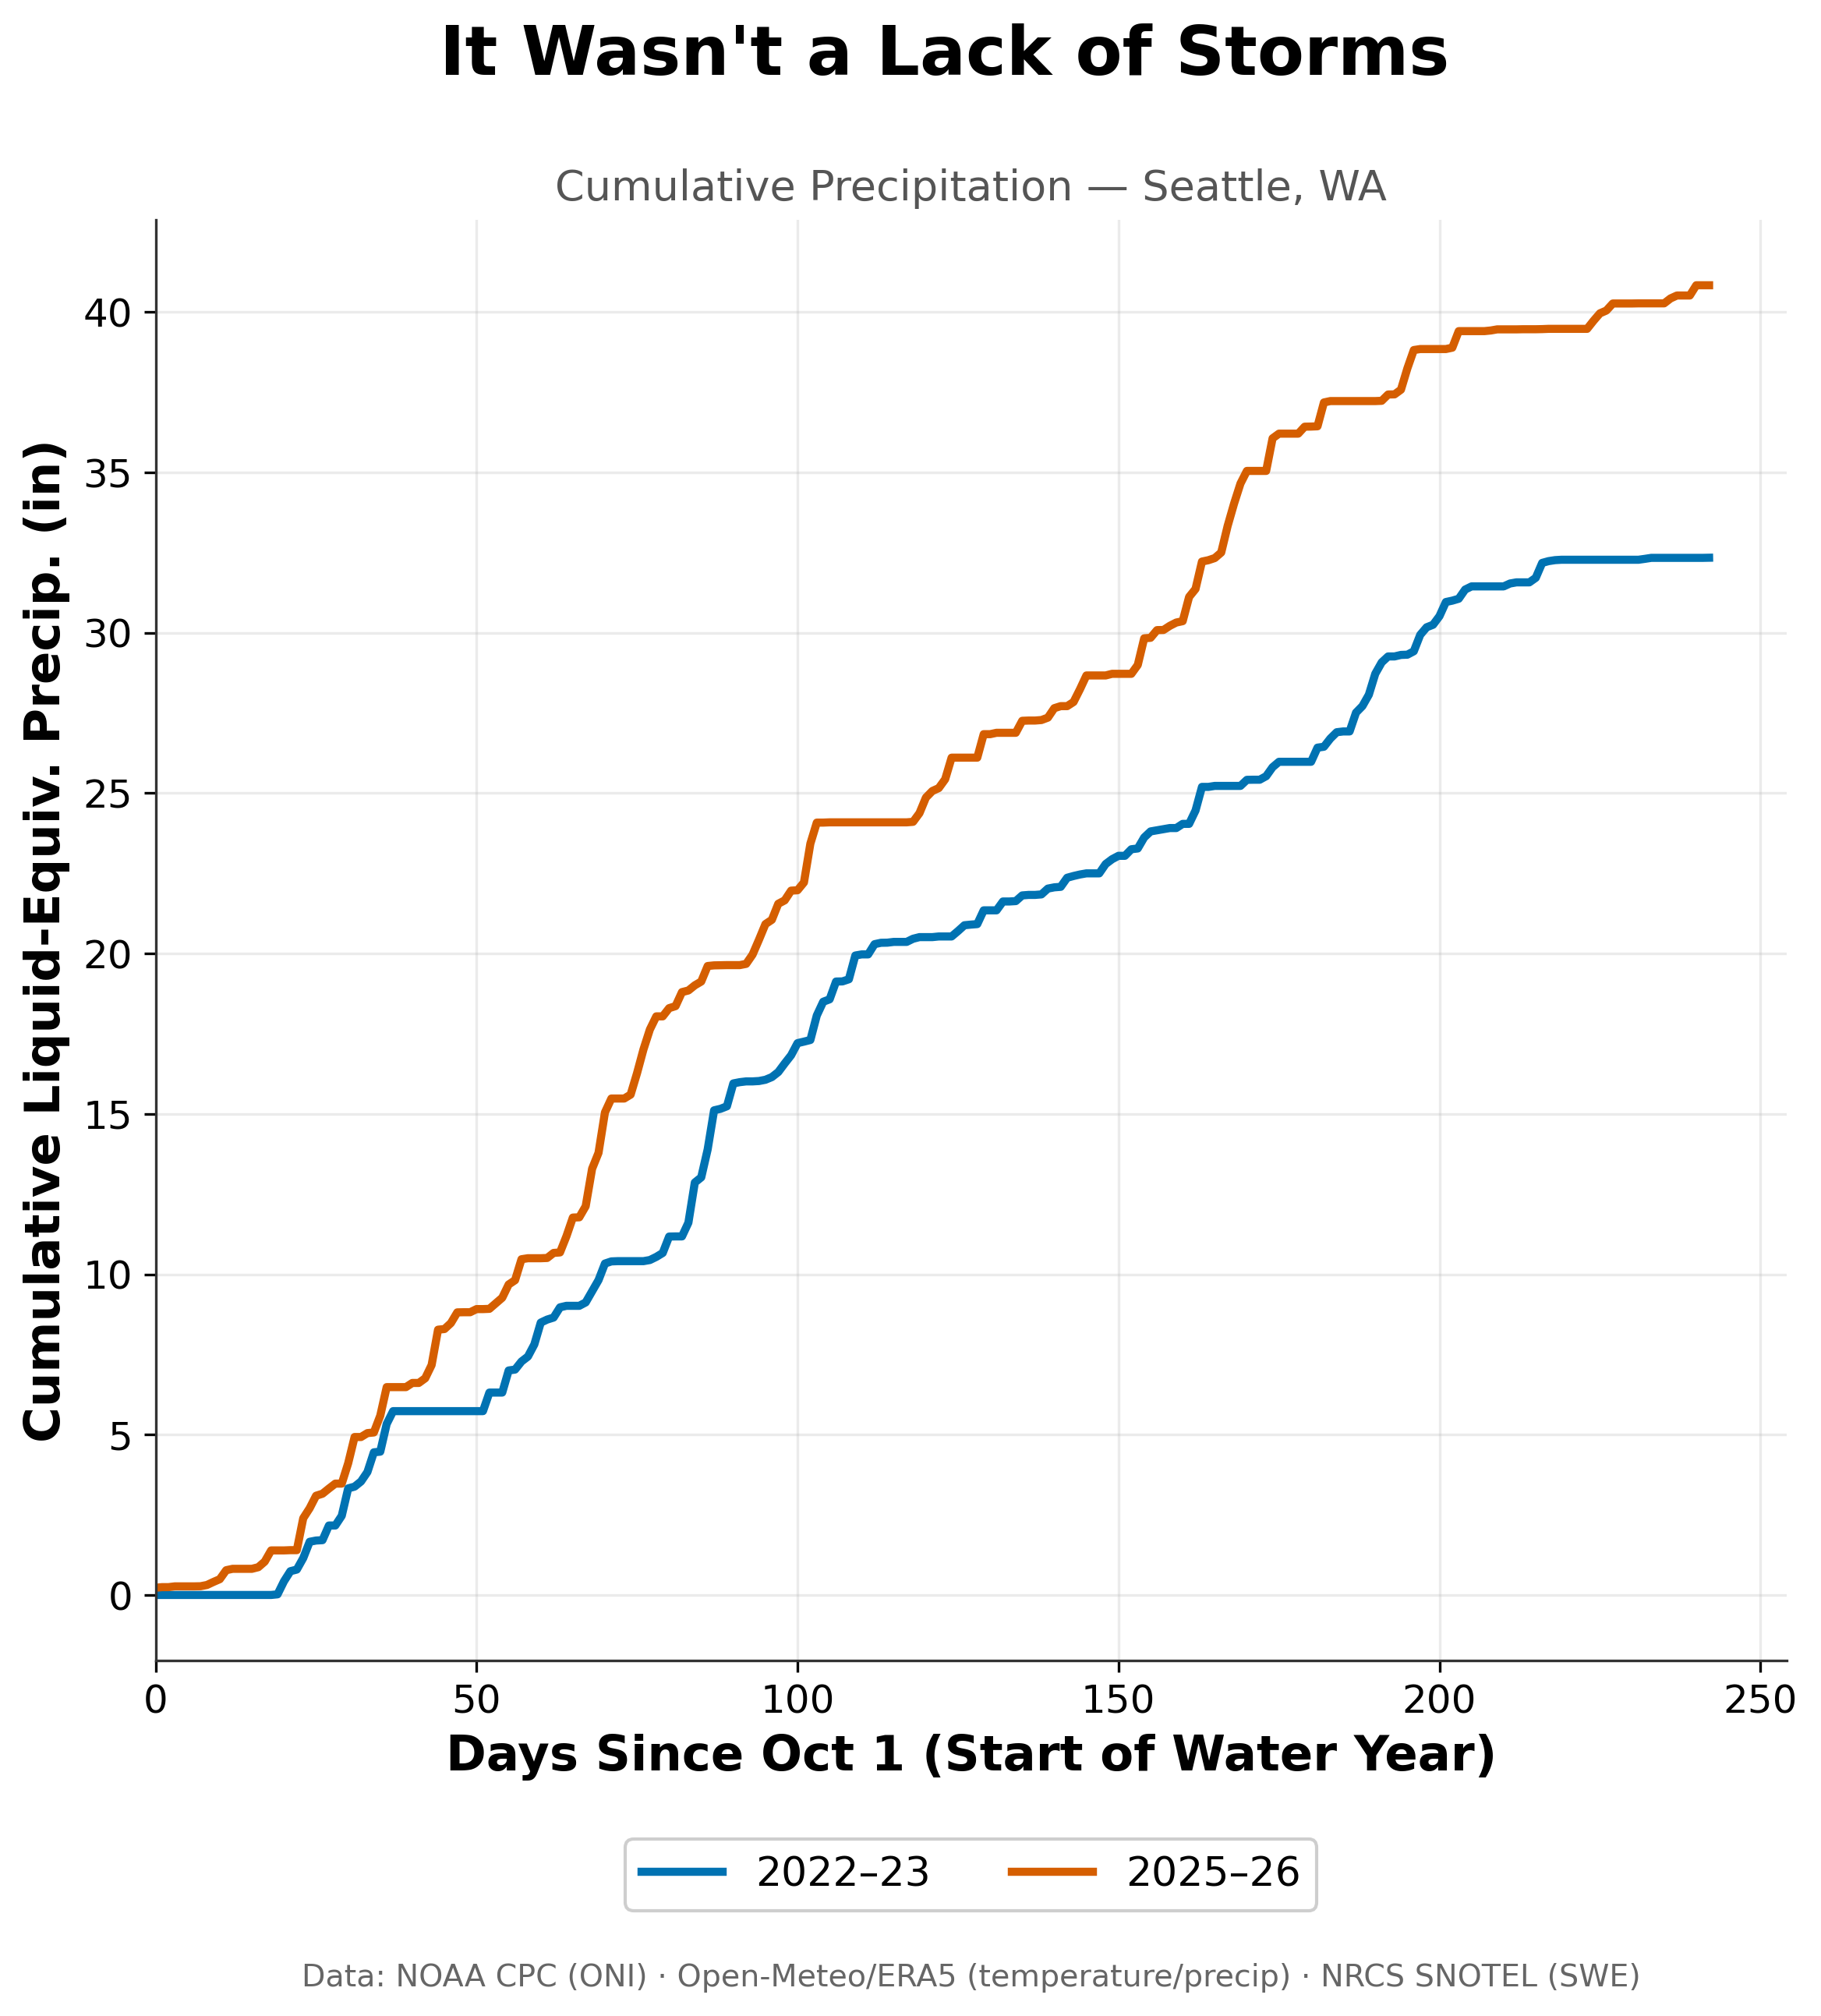
FIGURE 2: The lower-snow year wasn't a dry one — Seattle actually recorded more total precipitation in 2025-26 (red) than in the record-snow winter of 2022-23 (blue).
Cumulative liquid-equivalent precipitation in Seattle was actually higher during 2025-26 than during 2022-23. In other words, more total water fell from the sky during the season that produced less snow. Storms arrived, and they arrived carrying moisture but something else determined what happened to that moisture as it fell.
Temperature, Not Storm Count
To examine that question, the analysis looked at the thickness of the atmospheric layer between the 500 hPa and 200 hPa pressure levels, which serves as a useful proxy for how warm or cold the entire column of air above a location is. Warm air is less dense than cold air, so a warm air column occupies more vertical space, producing greater thickness values. Lower thickness values indicate a colder, more compressed column, which is typically associated with troughing and an active, cold storm pattern.
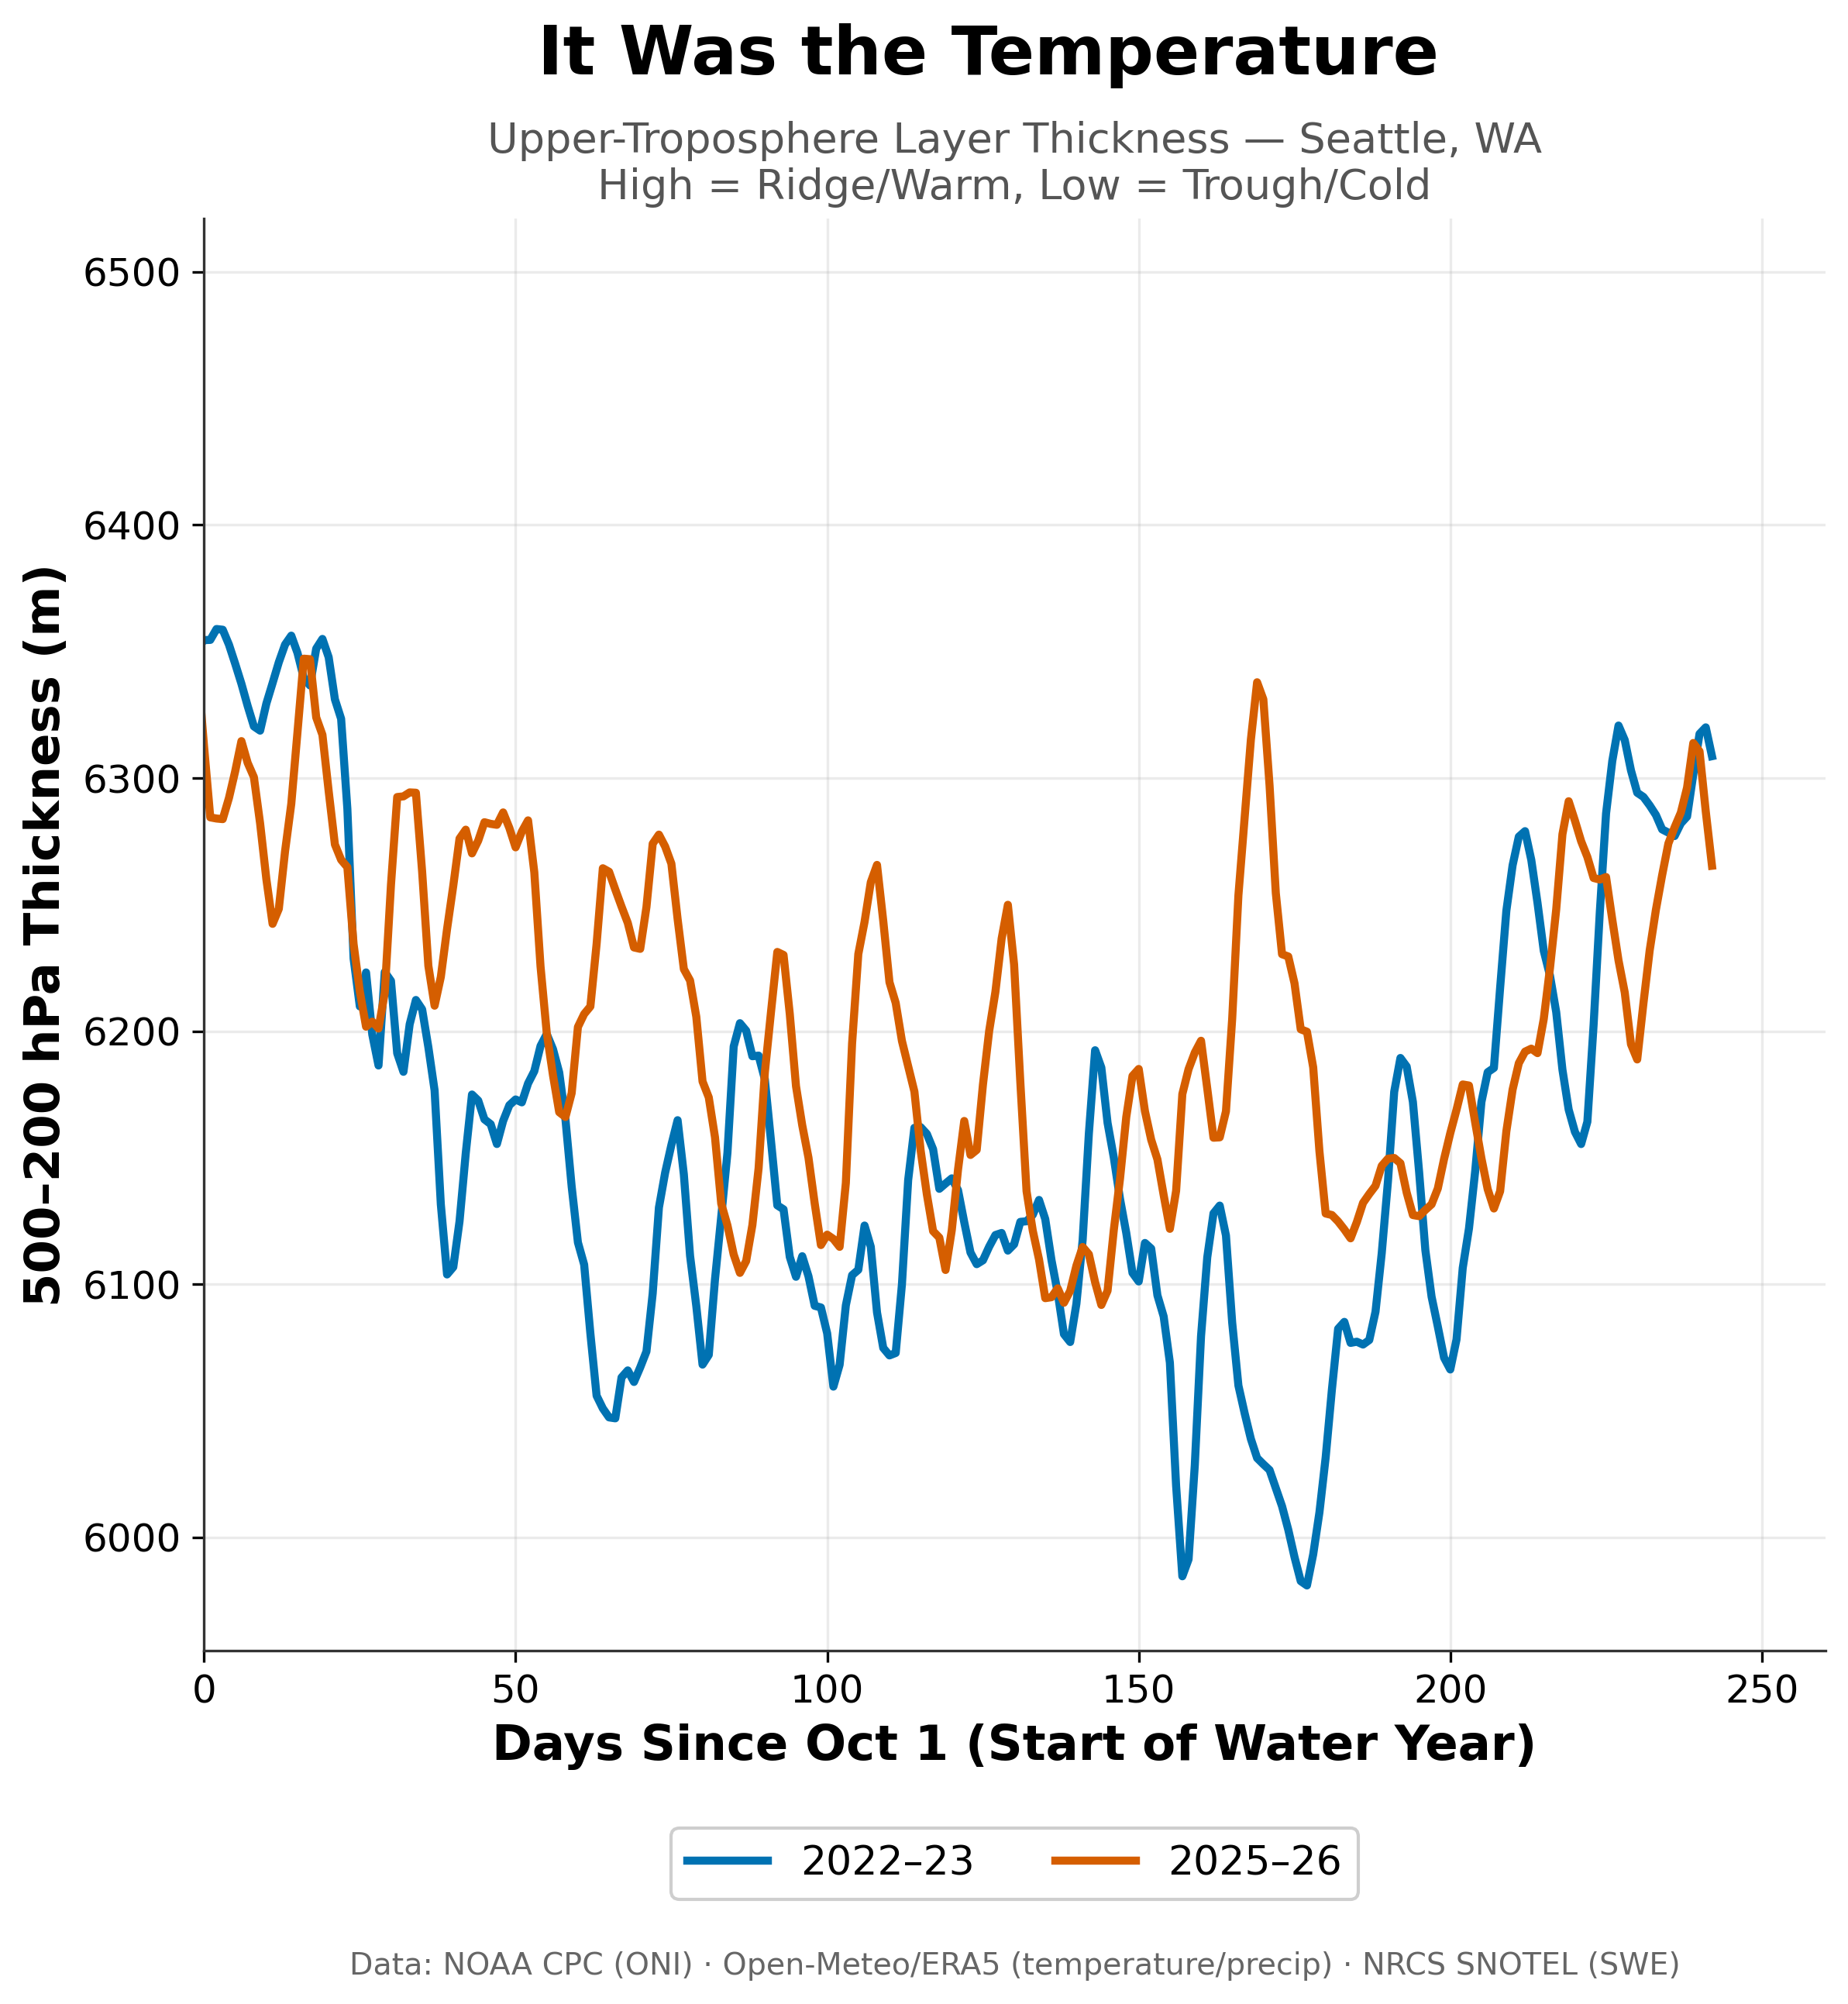
FIGURE 3: A measure of how warm or cold the air column was above Seattle each season — 2025-26 (red) ran consistently warmer through the winter than 2022-23 (blue), especially during a sharp spike in late winter.
Through the core of the season, 2025-26 generally ran warmer than 2022-23. A warmer air column raises the elevation at which precipitation transitions from snow to rain. The practical consequence for a mountain range is that identical storms produce very different results: in a colder season, moisture accumulates as snowpack across most of the terrain, while in a warmer season, a portion of that same moisture falls as rain at mid and lower elevations, or falls as denser, wetter snow that settles more quickly.
This distinction matters for how skiers interpret seasonal forecasts. Precipitation outlooks describe how much moisture may arrive, but they do not describe what form that moisture will take when it reaches the mountains. The 2025-26 season suggests that the second question may be at least as important as the first.
Does ENSO Help Explain Any of This?
ENSO describes a recurring pattern of warming and cooling in the equatorial Pacific Ocean, measured by the Oceanic Niño Index, or ONI. When the index is sufficiently positive the pattern is described as El Niño, when sufficiently negative it is described as La Niña, and when it falls in between it is described as neutral. Because ENSO influences the position and strength of the winter storm track across North America, it is frequently referenced in seasonal ski forecasts.
To evaluate how much predictive value ENSO actually carries in the Cascades, peak SWE for each water year from 1992 through 2026 was compared against the corresponding winter ONI value.
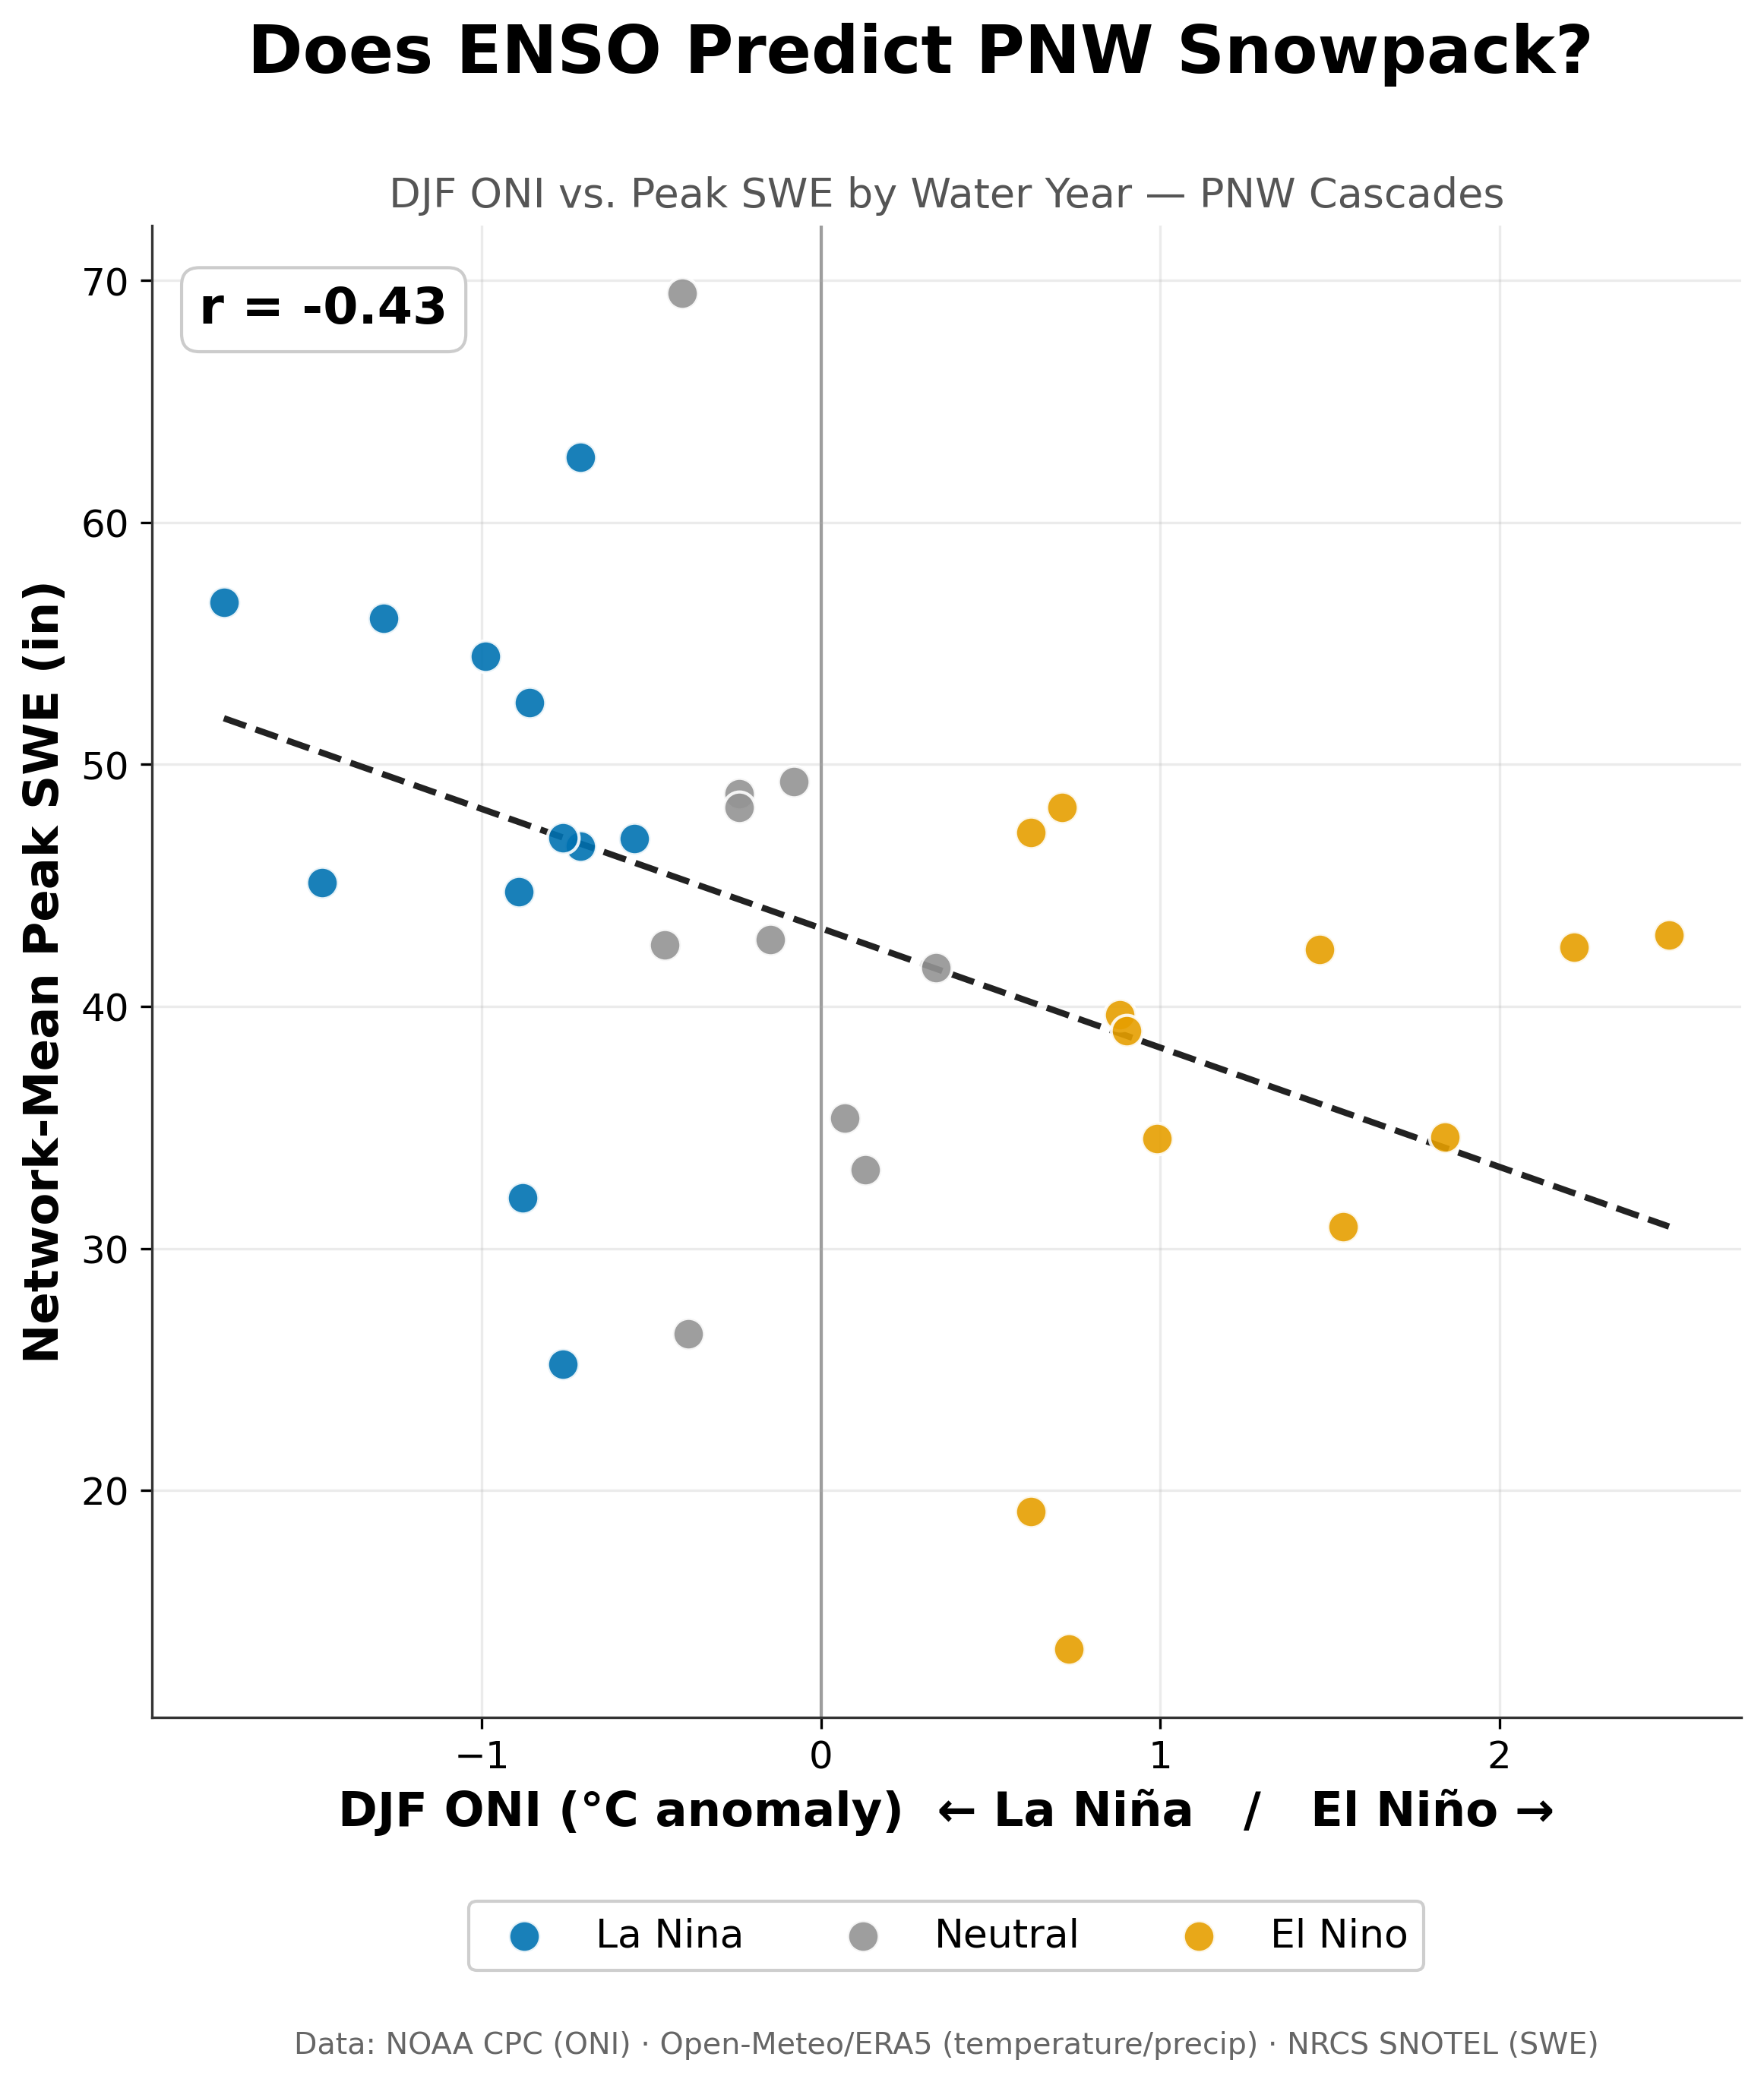
FIGURE 4: Across 35 winters, La Niña years (blue) tend toward higher Cascades snowpack and El Niño years (orange) toward lower — a moderate but real relationship (r = -0.43).
The relationship is negative, with a correlation coefficient of approximately -0.43, meaning that El Niño winters have tended toward lower peak snowpack in this region while La Niña winters have tended toward higher peak snowpack. A correlation of this magnitude represents a real and visible tendency, though it accounts for only a portion of the year-to-year variation, and individual seasons frequently depart from the pattern.
The temperature record shows a similar signal.
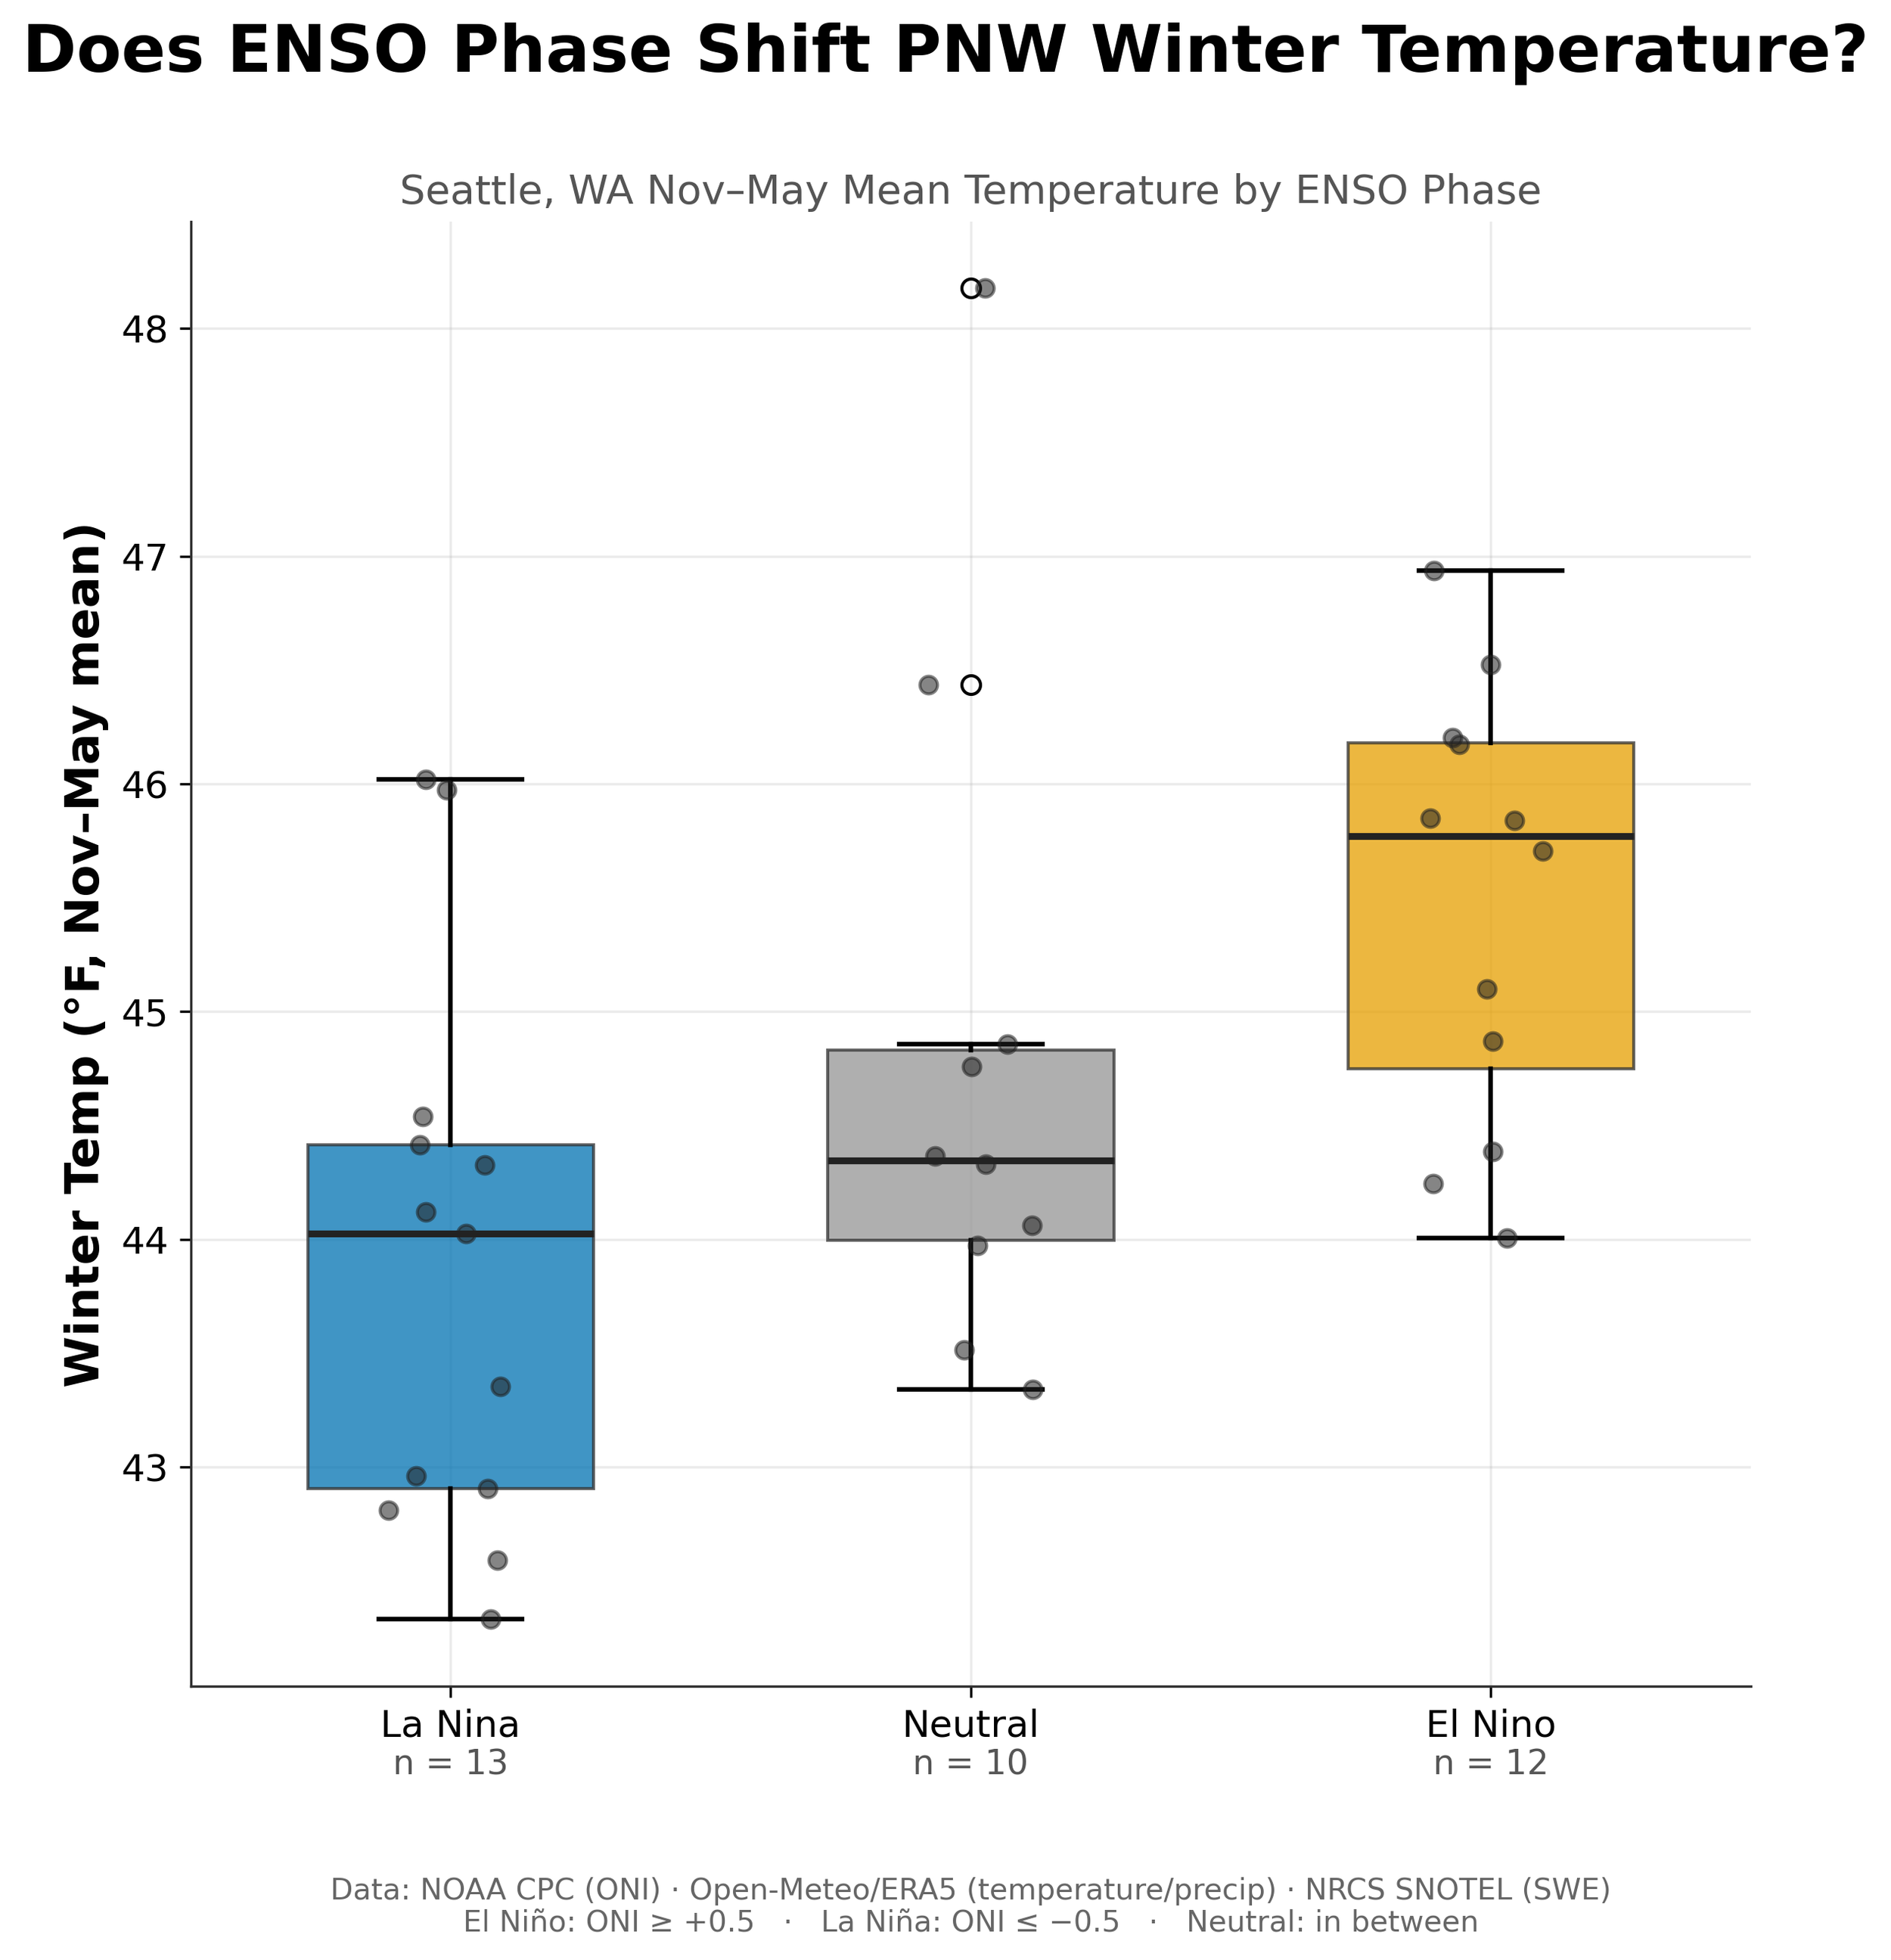
FIGURE 5: El Niño winters in Seattle run measurably warmer than La Niña winters on average, though individual years within each category vary widely.
Grouping winters by ENSO phase shows El Niño winters running warmer in Seattle than La Niña winters, with neutral winters falling between them. The distributions overlap considerably, which indicates that phase alone does not determine the outcome of any particular winter, but the ordering of the three groups is consistent with what the physical mechanism would predict.
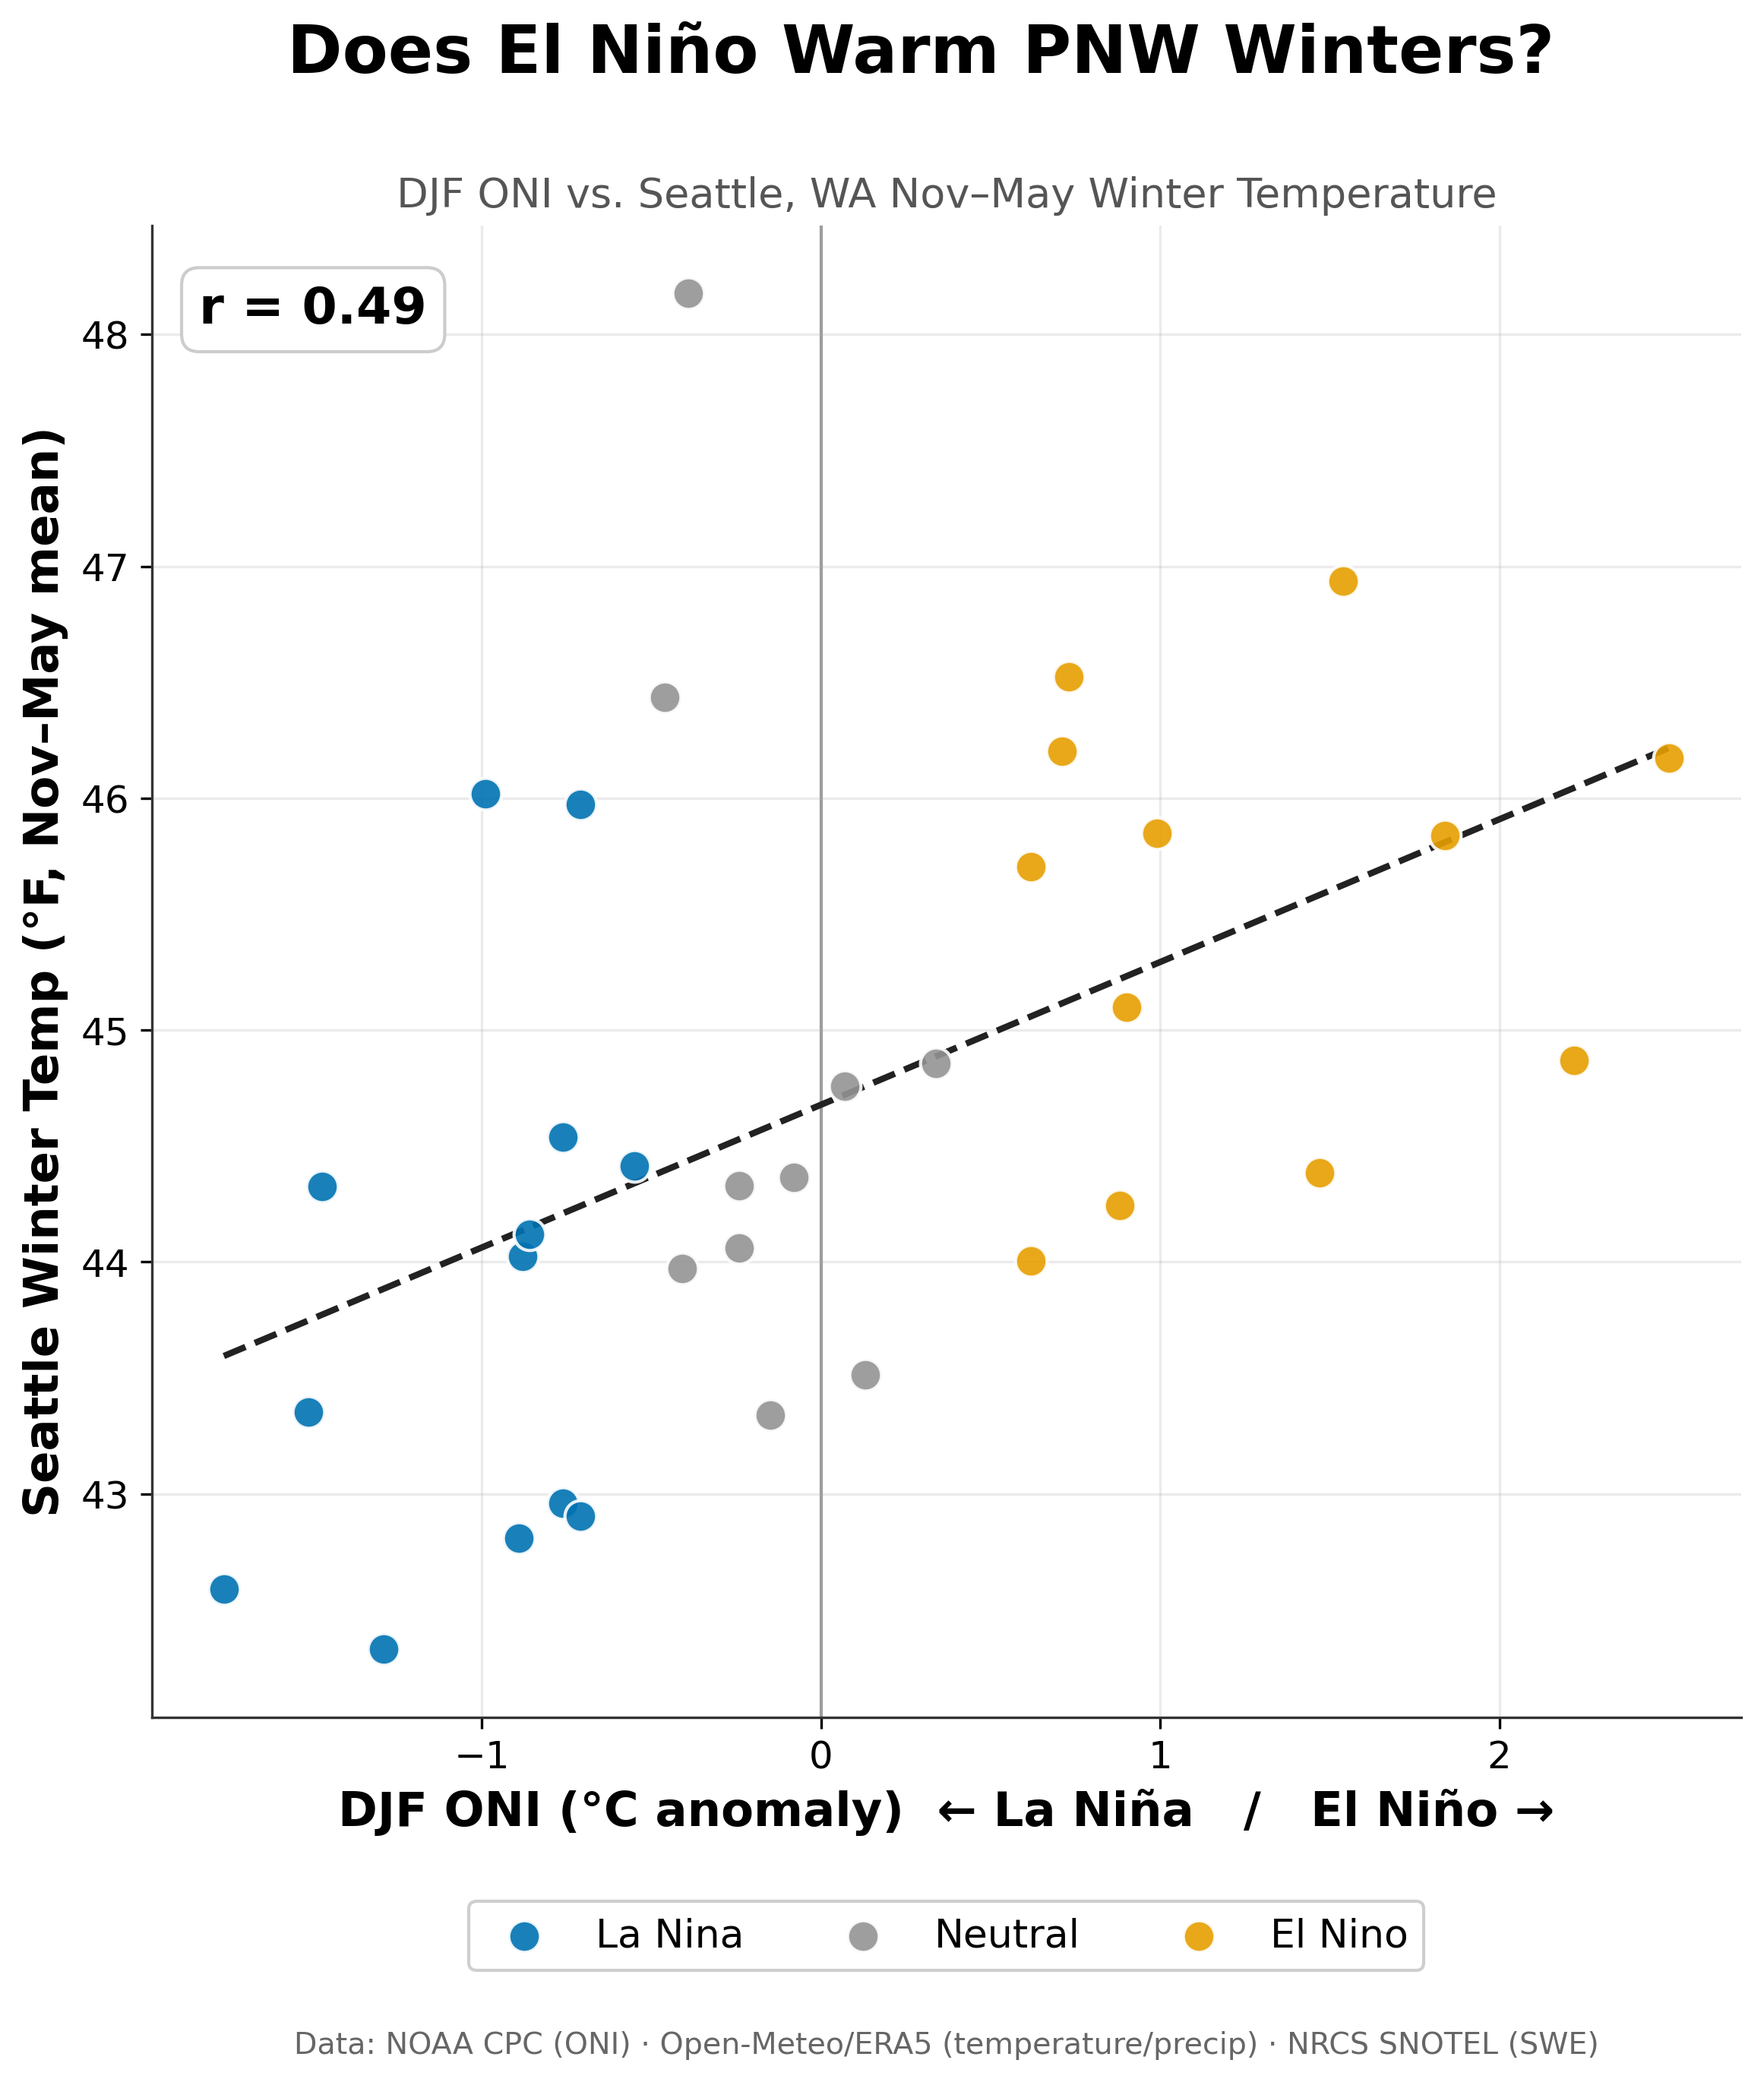
FIGURE 6: The clearest signal in the whole study: ENSO phase and Seattle winter temperature move together fairly closely (r = 0.49), with El Niño winters reliably warmer than La Niña winters.
Examined as a continuous relationship rather than as discrete categories, winter temperature correlates with ONI at approximately 0.49, which is the strongest relationship identified anywhere in this project.
The Regional Contrast Is the Most Interesting Result
A parallel version of this analysis was previously conducted for northern Utah, using identical methods and the same ENSO index. In that region, the correlation between ONI and winter temperature was approximately 0.08, which is effectively indistinguishable from no relationship at all.
The same analytical approach therefore produced a somewhat meaningful signal in the Pacific Northwest and essentially no signal in Utah. This difference is consistent with the geography of the two regions. The Pacific Northwest sits within the portion of the storm track that ENSO most directly displaces, while Utah sits near the boundary between the wetter northern pattern favored during La Niña and the drier southwestern pattern favored during El Niño, where the competing influences may largely offset one another.
The practical implication is that ENSO-based seasonal guidance should not be applied uniformly across the West. A statement about what El Niño may mean for snowpack can be reasonably informative in the Cascades while carrying very little information in the Wasatch.
Important Limitations
Several constraints should be considered when interpreting these results.
The snowpack record relies on seven SNOTEL stations distributed across the Washington Cascades, which serve as a reasonable representation of the regional ski corridor but do not constitute a comprehensive survey of all mountain terrain in the Pacific Northwest. Temperature and precipitation are drawn from Seattle, which sits at low elevation and therefore does not directly measure conditions at the elevations where skiing occurs, though it does capture the broader regional air mass reasonably well.
The analysis covers 35 winters. This is sufficient to identify a tendency but not sufficient enough to characterize it precisely, and correlation coefficients calculated from samples of this size remain sensitive to individual unusual years.
Correlation also describes association rather than causation, and the correlations reported here are linear, meaning they would not capture a relationship that operates differently at different ENSO strengths.
Finally, and most importantly for anyone hoping to apply these results to the upcoming season, the 2025-26 winter itself illustrates the limits of the approach. That season occurred under weak La Niña conditions that weakened toward neutral as winter progressed, which is the phase generally associated with colder and snowier conditions in the PNW. It nonetheless produced a warm season with substantially reduced snowpack. Even where ENSO carries real predictive value, individual seasons may depart from the expected pattern entirely.
Summary
The difference between the 2022-23 and 2025-26 seasons in the Pacific Northwest does not appear to have been driven by a shortage of storms, since more total precipitation fell during the weaker snow year. The difference appears instead to be related to temperature, with a warmer atmospheric column during 2025-26 likely raising the rain-snow line and reducing how much of the arriving moisture accumulated as snowpack.
Across the longer record, ENSO does show a measurable relationship with both snowpack and winter temperature in the Cascades, and that relationship is considerably stronger than what the same analysis found in northern Utah. ENSO therefore appears to carry genuine regional information for skiers in the Pacific Northwest, provided it is understood as one contributing factor among several rather than as a seasonal forecast in itself.
The next phase of this project will examine shorter-timescale atmospheric patterns, including the Pacific-North American pattern and the Madden-Julian Oscillation, to determine whether they explain more of the season-to-season variability than ENSO alone.
