Last story, I looked at historical Super El Niño events to see if there is any consistent signal to use in my forecast for this upcoming winter. I found a clear signal in only the Cascades. It got me wondering: will there be a clearer pattern if I look at all El Niño years instead of just the extreme ones? With all El Niño years, Utah now tilts toward dry. For Tahoe and the San Juans it's a coin flip with huge swings.
I pulled every El Niño winter from 1981 to 2017, totaling to 14 in all, and stacked them against the 23 La Niña and neutral winters in the same stretch.
I stuck with the same four ski regions I’ve been studying: the Washington Cascades, Utah's Wasatch, Lake Tahoe and Colorado's San Juans.
I was hoping this mini project would paint a clearer picture, but unfortunately, it did not. Let’s take a look.
El Niño over time
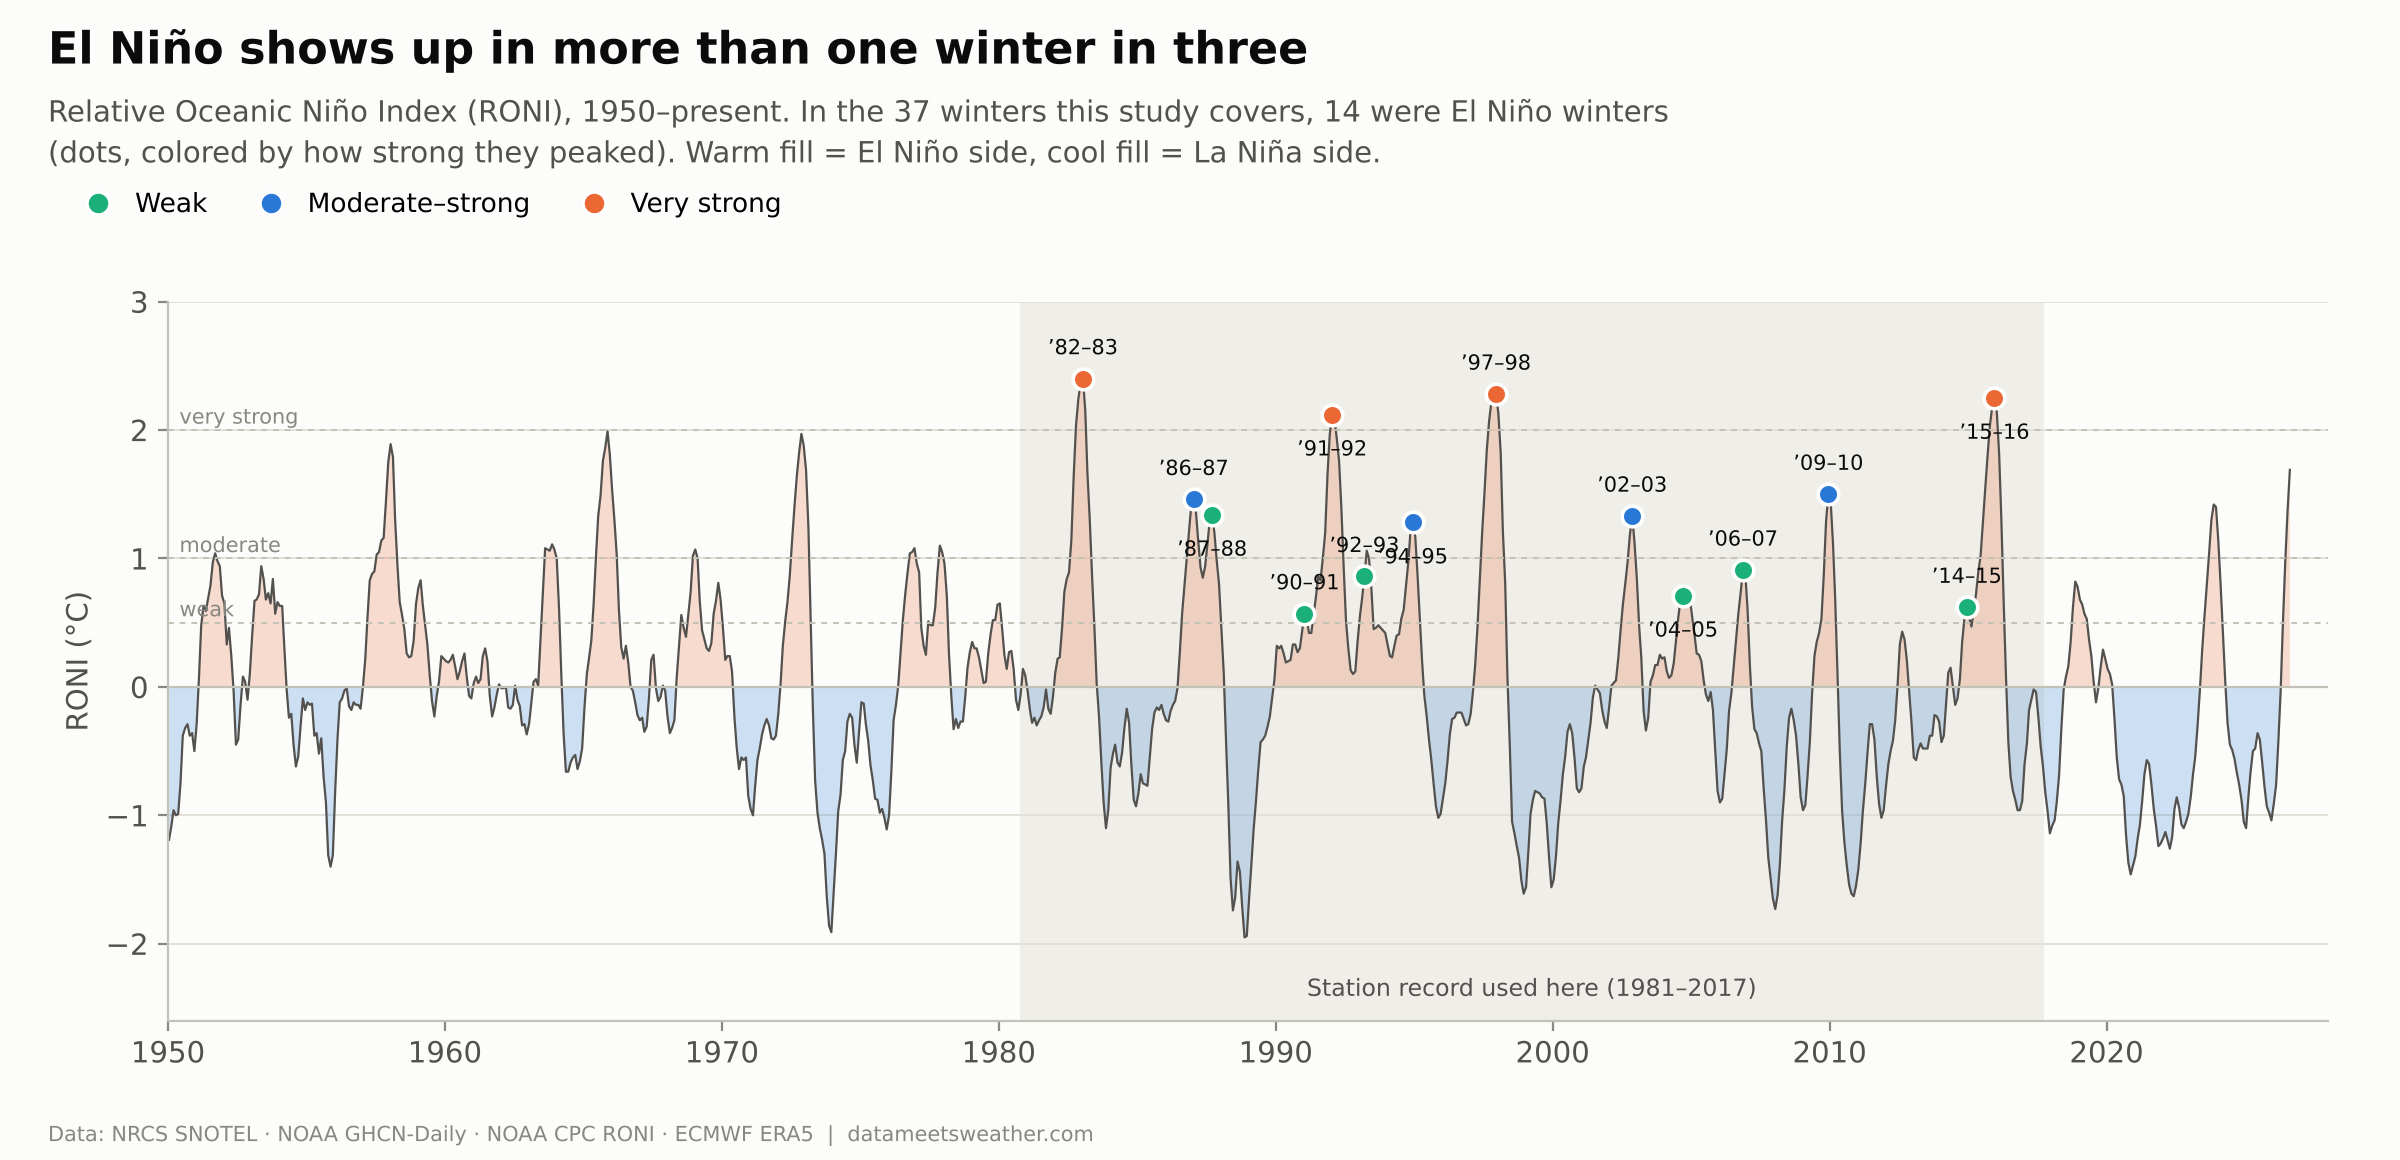
Statistically, more than one winter out of three is an El Niño winter. In other words, they are common but can come in different sizes. I sorted the El Nino years by peak strength on NOAA's Relative Oceanic Niño Index (RONI) and created 3 buckets:
Very strong (+2.0 °C or more): 4 winters, including 1982–83 and 2015–16
Moderate–strong (+1.0 to +2.0): 4 winters
Weak (+0.5 to +1.0): 6 winters
El Niño winter scorecard
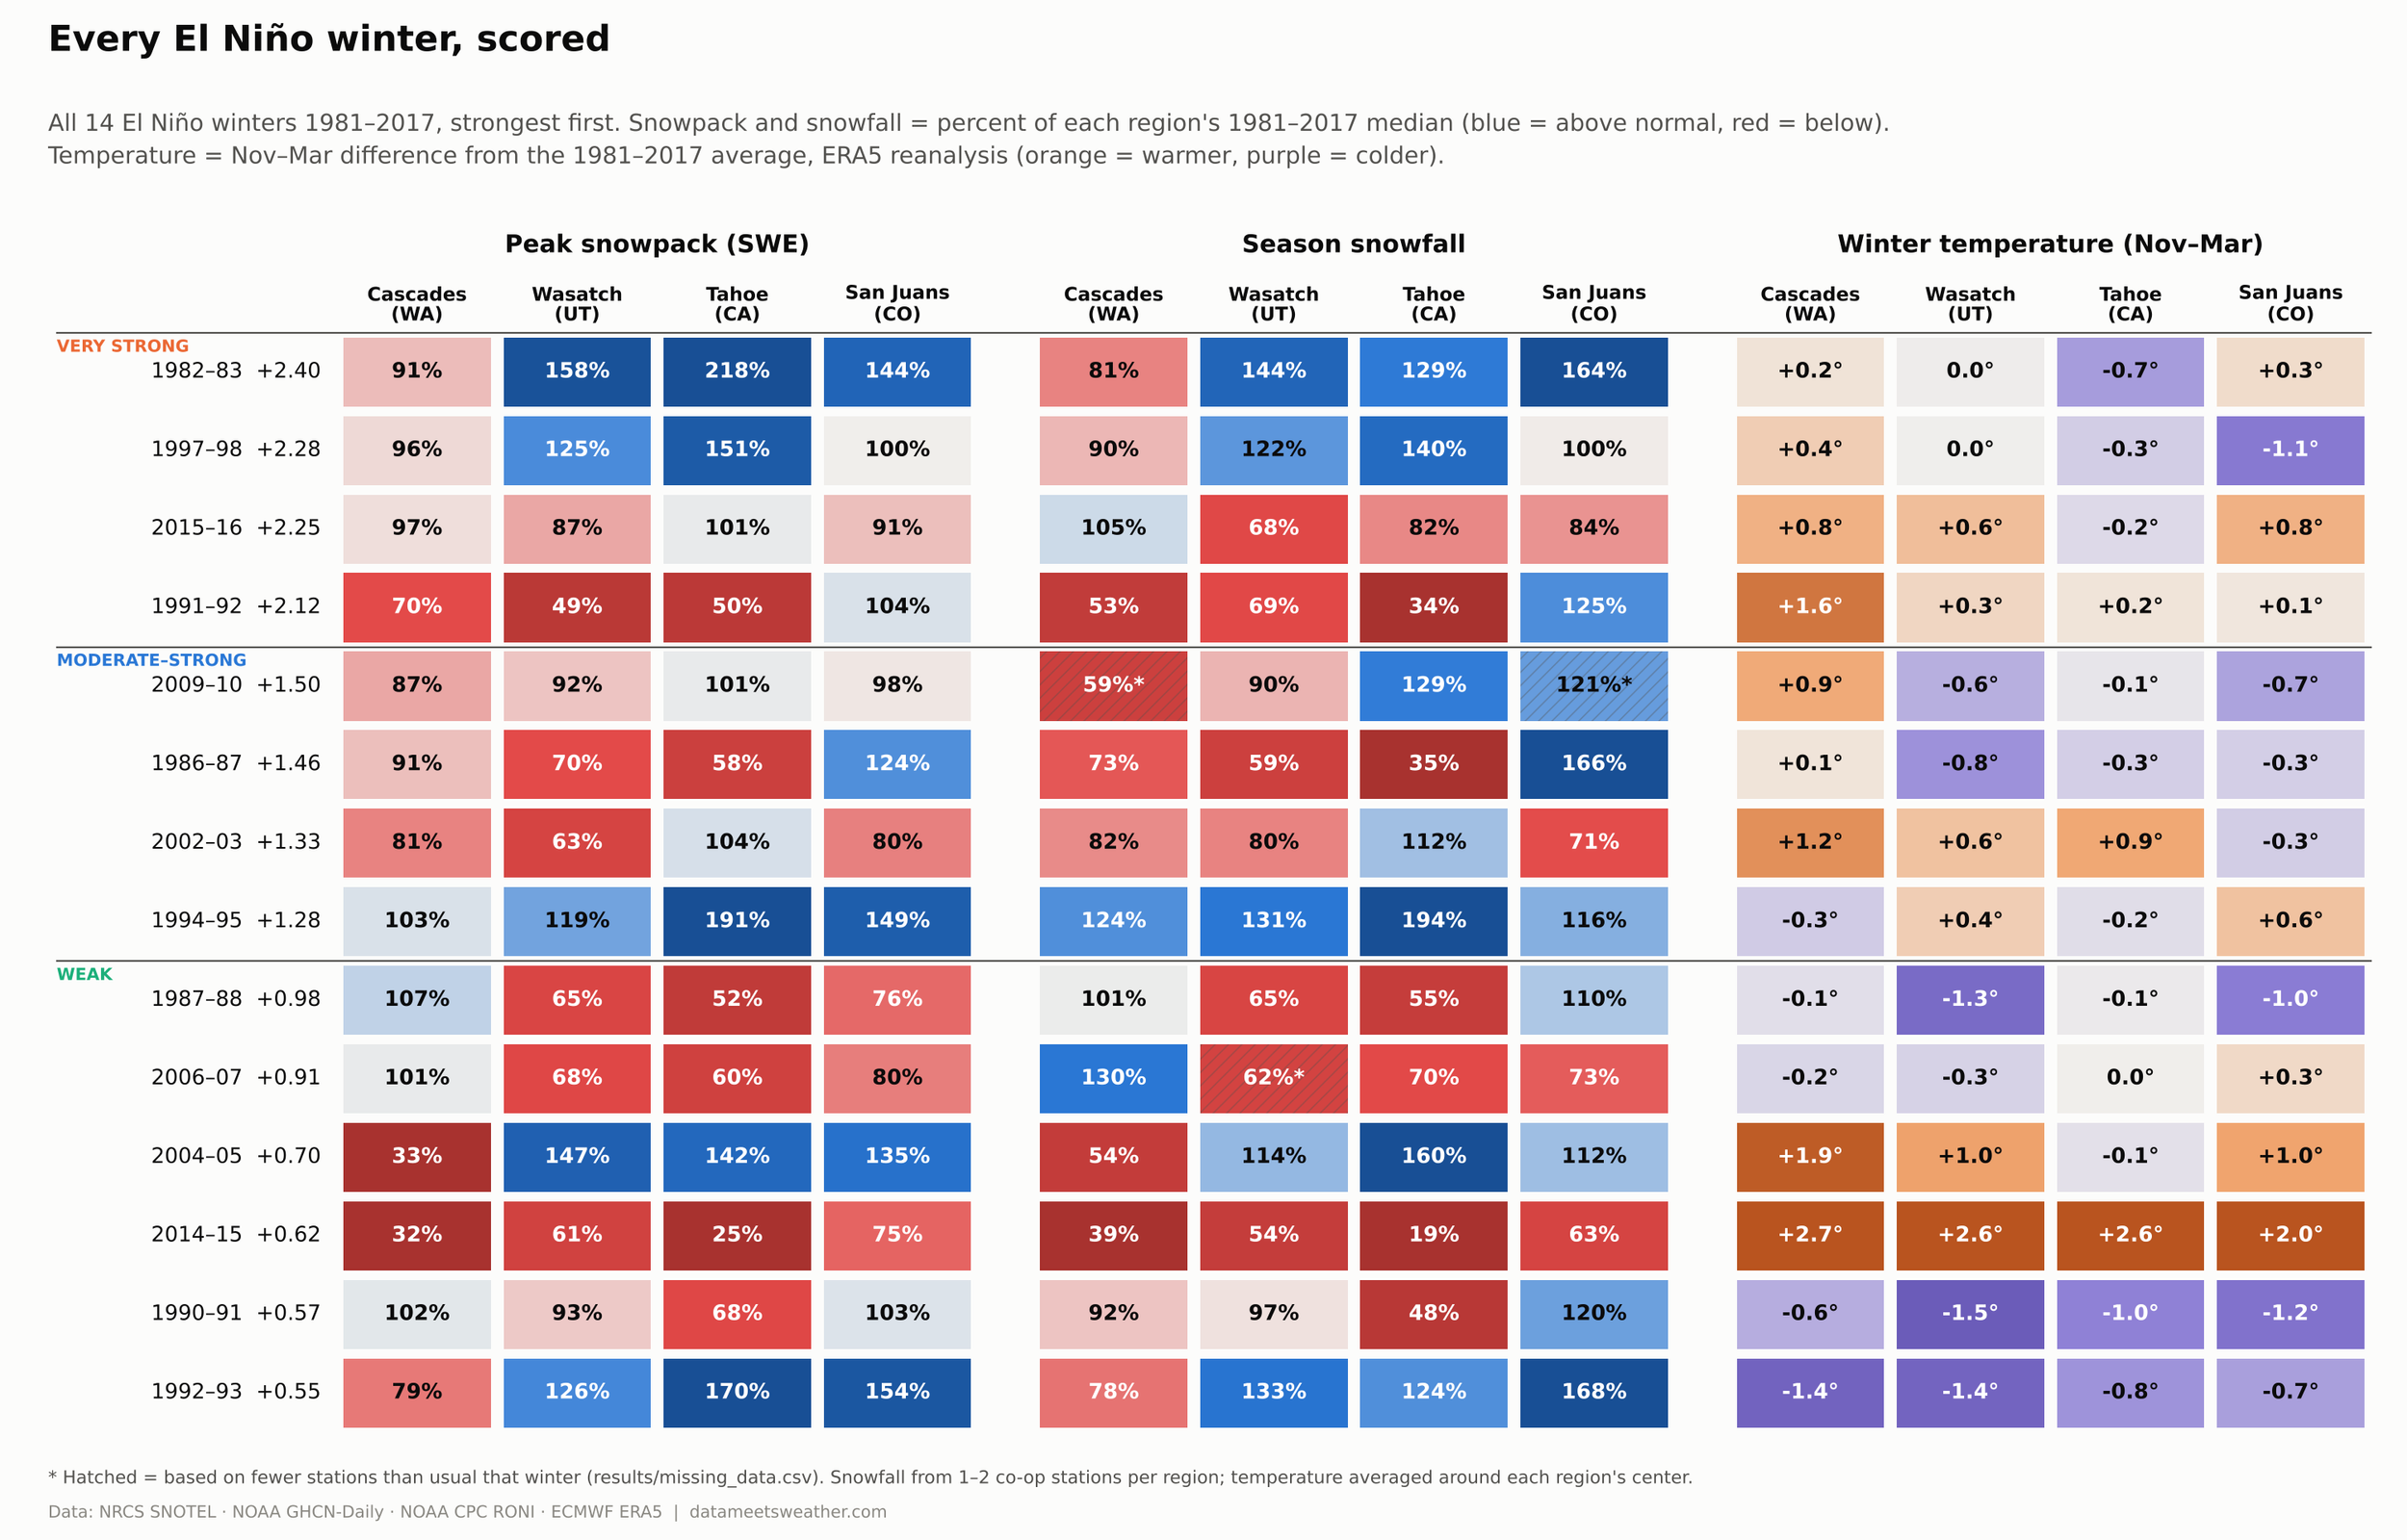
Here's every El Niño winter in every region, with the strongest at the top. Blue means above-normal snow, red below. Orange means warmer than average, purple colder.
The worst row isn't one of the big ones. 2014–15, a weak El Niño, was the warmest El Niño winter in all four regions, sitting at 2.0 to 2.7 °C above average. Tahoe's snowpack fell to 25% of normal and the Cascades to 32%.
Is an El Niño winter actually different?
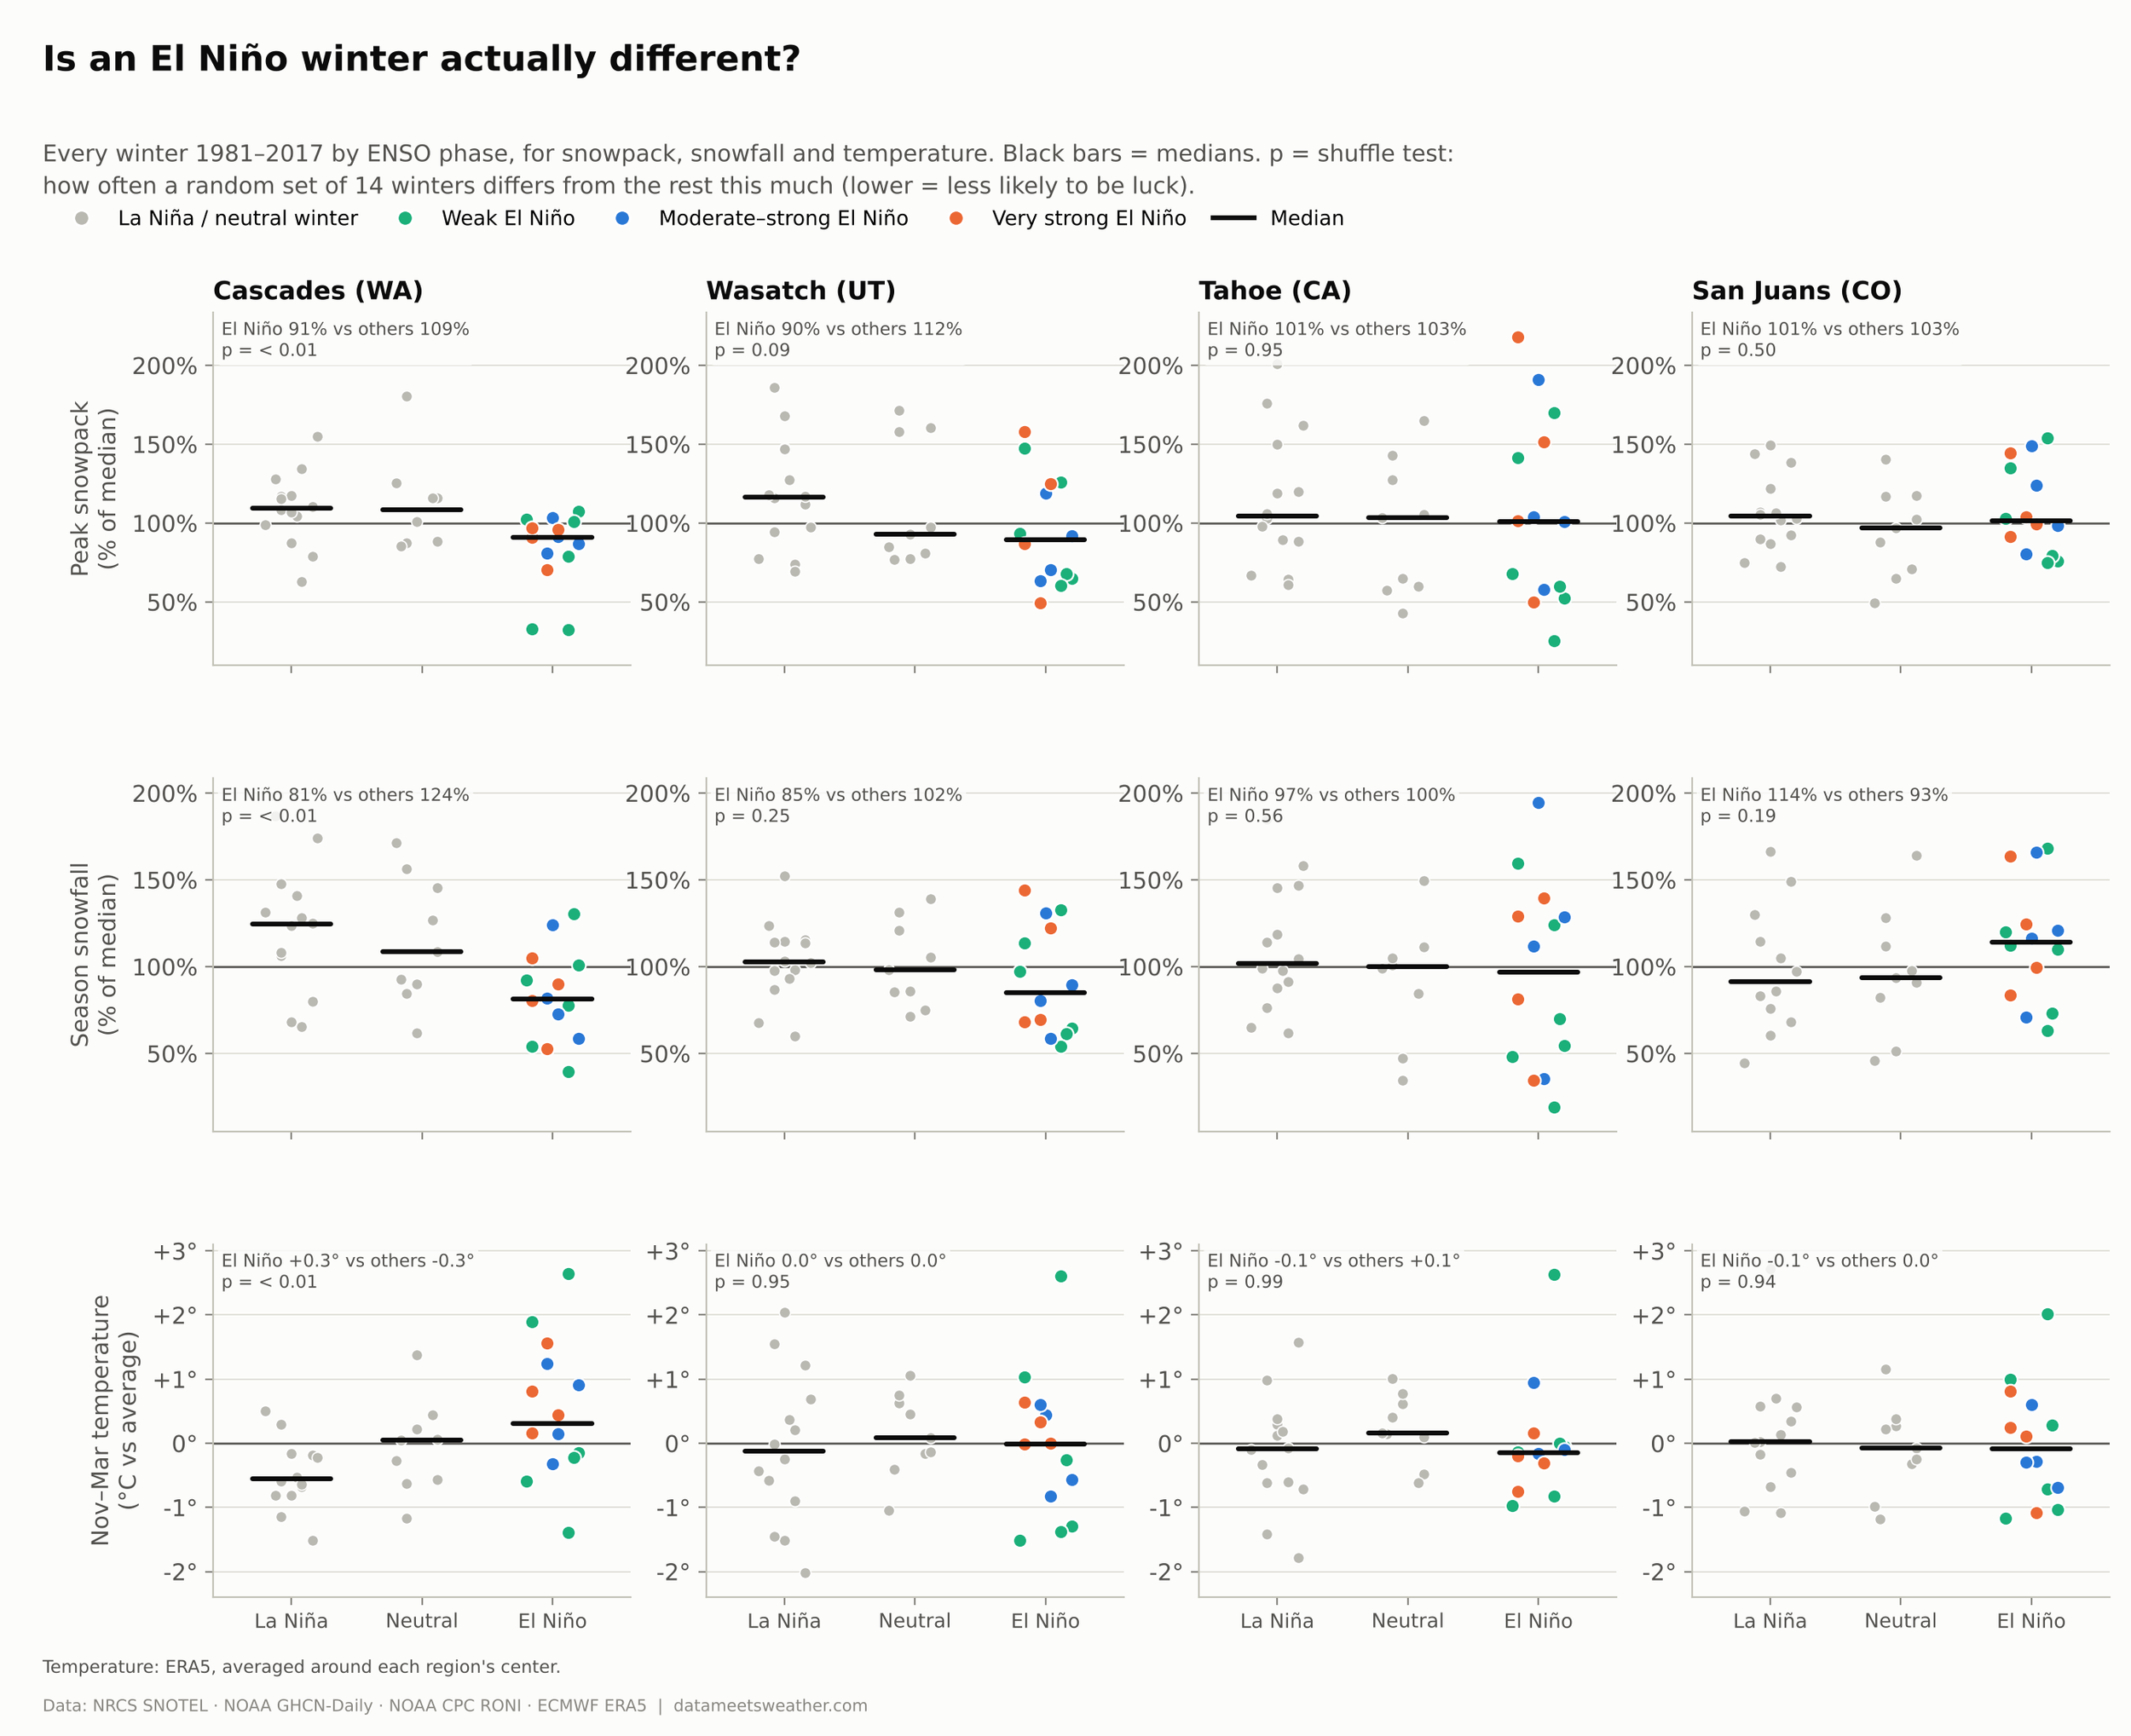
This is the core of the story: El Niño winters (colored dots) against every other winter (gray). The "p" in each panel is a shuffle test. It asks how often a random set of 14 winters would differ from the rest this much just by luck. Lower is more convincing.
Washington’s Cascades gets crushed by El Niño, clearly. Median snowpack is 91% of normal in El Niño winters vs 109% in other winters. Snowfall: 81% vs 124%. And El Niño winters run about 0.6 °C warmer. All three pass the shuffle test (p < 0.01).
Utah’s Wasatch leans dry on average. Median snowpack 90% vs 112% (p = 0.09). Temperature is no different, so the losses come from fewer storms, not warmer ones.
California’s Tahoe has no clear signal and swings wildly. Medians of 101% vs 103%, yet El Niño winters ran anywhere from 25% to 218% of normal snowpack.
Colorado’s San Juans also has no signal in snowpack but a tilts slightly toward more snowfall.
Out of the 14 El Niño winters, 9 brought above-normal snowfall (median 114% vs 93%), though it doesn't pass the shuffle test (p = 0.19).
Storm tracks and temperature
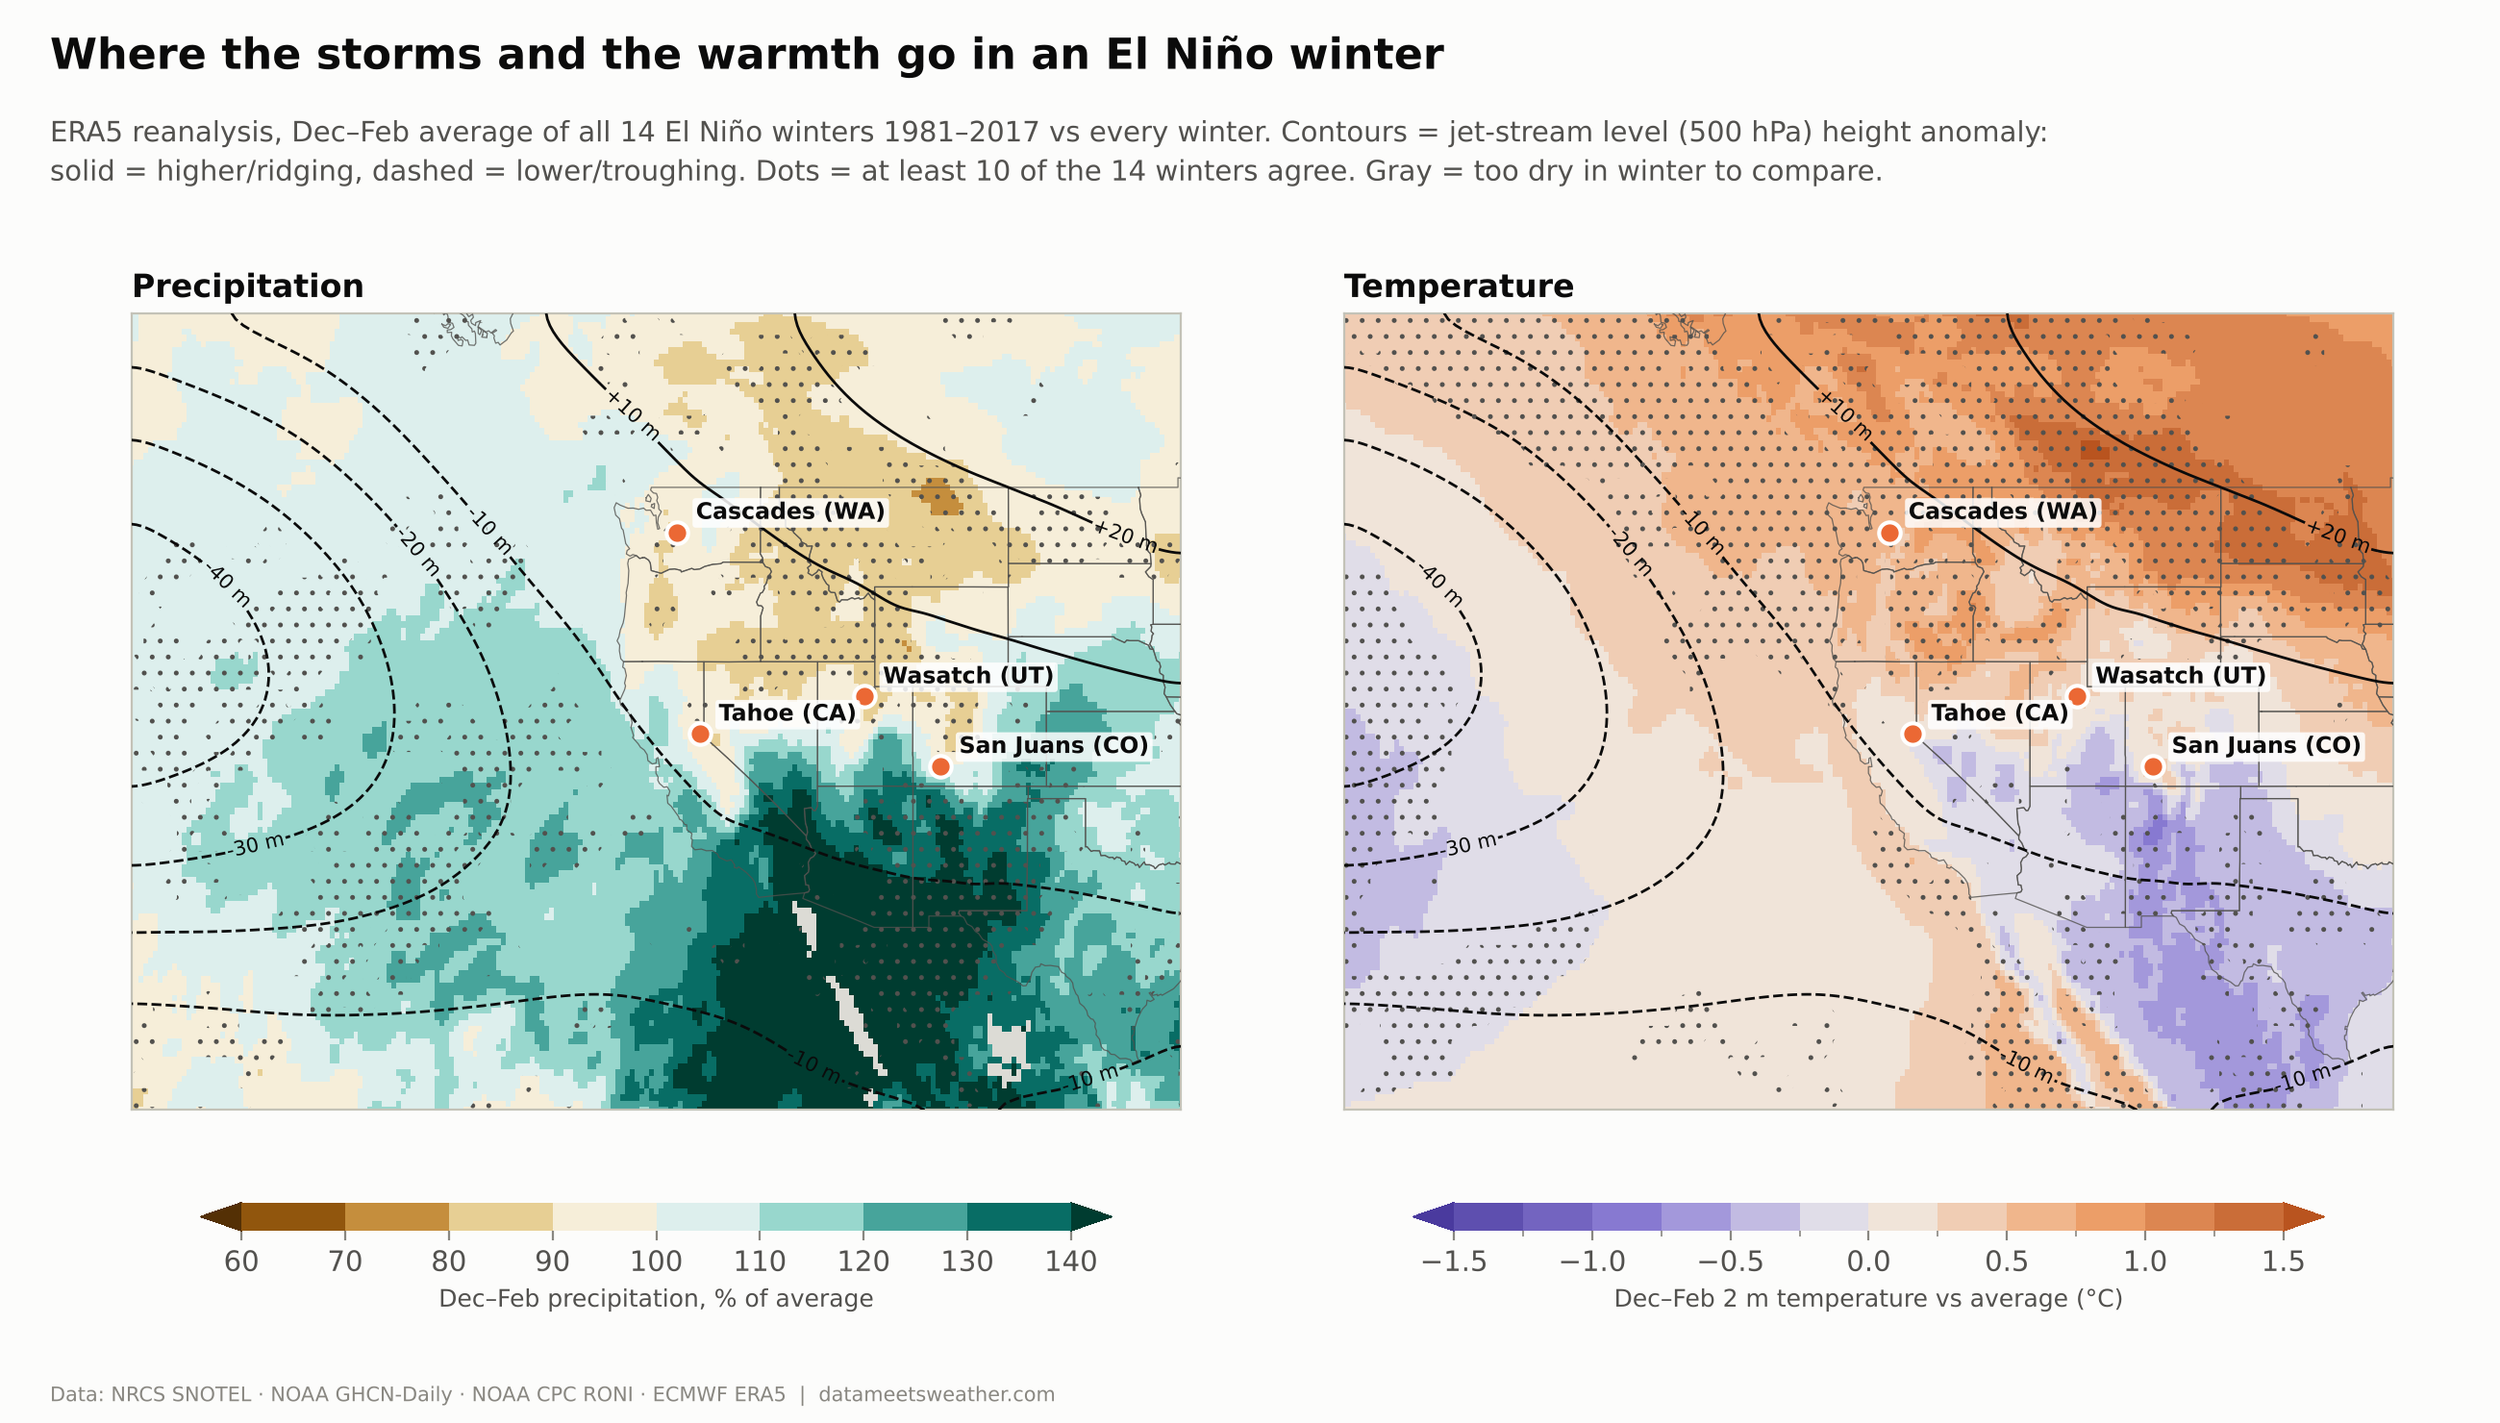
This map averages all 14 El Niño winters (Dec–Feb) using ERA5, a reconstruction of the atmosphere. Green is wetter than normal and brown is drier. On the right, orange is warmer and purple is cooler. The lines show the average location of the jet stream and shape.
A dip in the jet stream off California steers storms into Southern California, Arizona and New Mexico.
A ridge over the northern tier keeps Idaho and Montana dry and parks warmth over the Pacific Northwest.
The Cascades sit right under the ridge’s warmth. That's why they lose on both snow and temperature.
The Wasatch sits near the line between wet and dry, and the San Juans sit on the edge of the wet zone. Small shifts in the storm track decide their winters.
Your region's El Niño odds
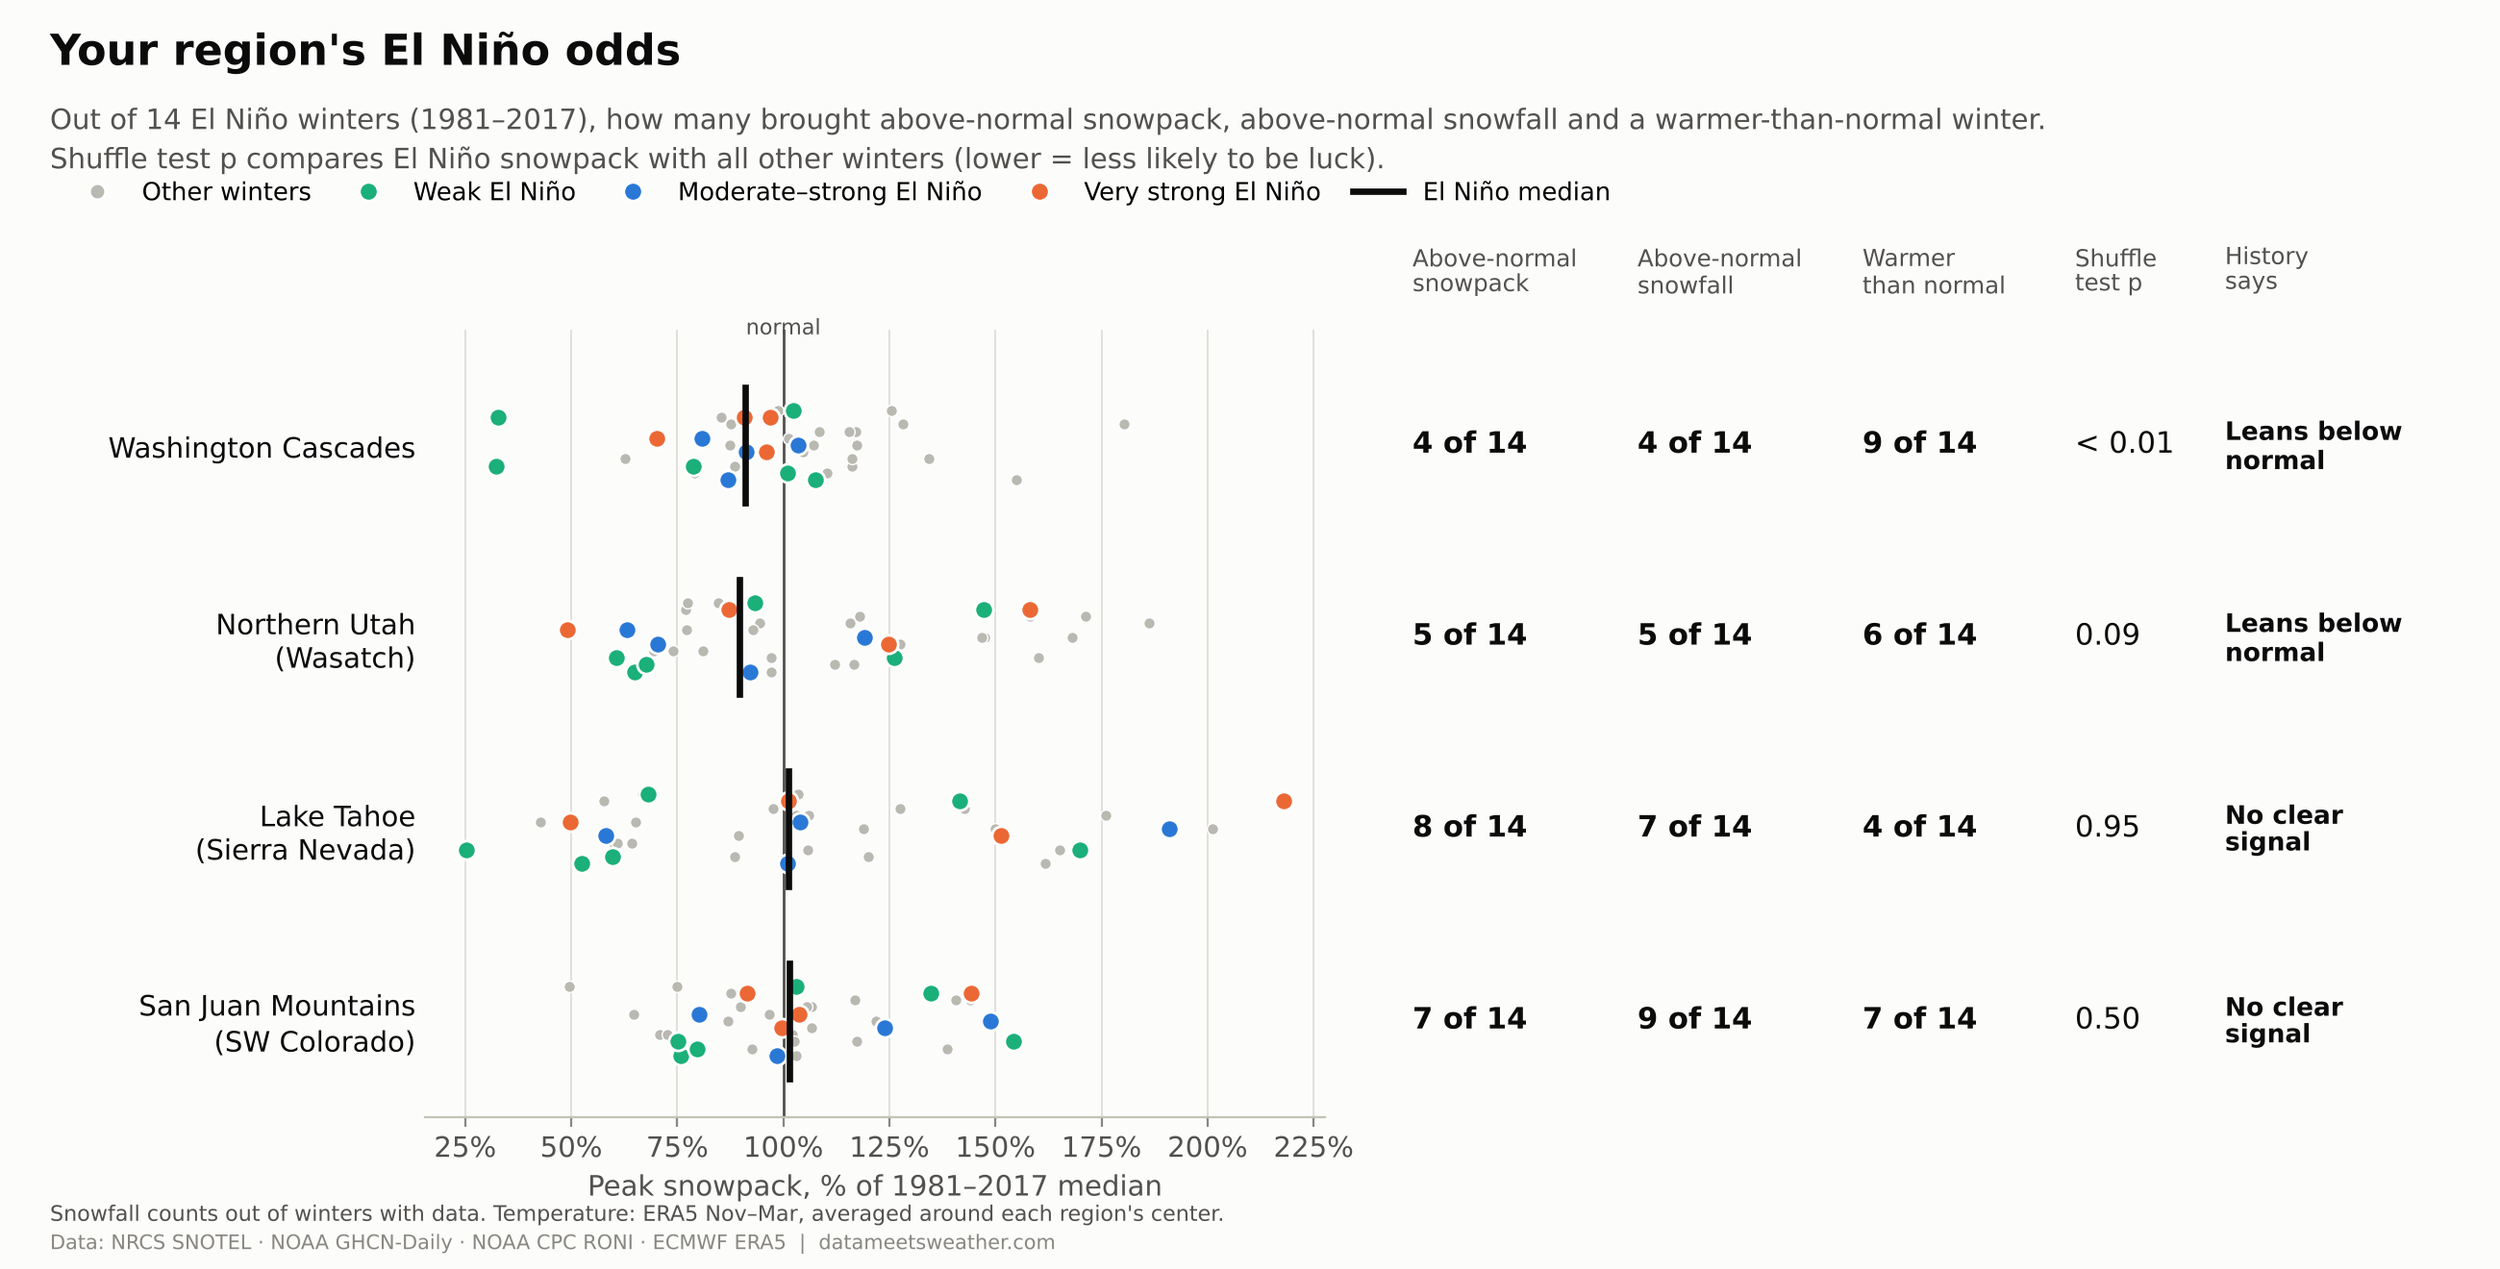
Out of 14 El Niño winters, here's how often each region got above-normal snowpack:
Cascades: 4 of 14. History leans below normal.
Wasatch: 5 of 14. History leans below normal.
Tahoe: 8 of 14. No clear signal.
San Juans: 7 of 14. No clear signal.
My takeaway as a meteorologist and a skier: El Niño is a real signal in Washington, noise in Utah and Tahoe, and a nudge in the San Juans. If you ski the Cascades, plan for a leaner, warmer year. Everywhere else, the storm track will decide your winter one storm at a time.
Caveats
14 El Niño winters is a small sample. The shuffle tests are there to separate signal from luck. Read the rest as odds, not a forecast.
"Normal" means each station's 1981–2017 median, not NRCS's official 1991–2020 normals.
Temperature comes from ERA5, averaged around each region's center. It's best read as warmer or colder than usual, not as on-mountain temperatures.
Missing data: snowpack coverage was complete. Three snowfall values rely on one of two stations: Cascades and San Juans in 2009–10, and Wasatch in 2006–07. They're hatched in the scorecard.
Data: NRCS SNOTEL (snowpack), NOAA GHCN-Daily (snowfall), NOAA CPC Relative Oceanic Niño Index (RONI), ECMWF ERA5 reanalysis (temperature, precipitation, jet stream).
