What made the 2023 and 2026 Ski seasons so different in Utah?
Utah had two of its most talked-about ski seasons in recent memory. The 2022-23 ski season broke snowfall records across the Wasatch. However, the 2025-26 ski season did the opposite with record-low snowpack, despite storms showing up on schedule. Same mountains and same quantity of precipitation but wildly different outcomes.
It's easy to blame El Niño and La Niña — it’s the climate pattern people reach to first, including me. I was curious to know how much ENSO influenced ski season here in Utah. Could it be what caused two dramatically different seasons? As it turns out, the El Niño Southern Oscillation is not a very good explanation here — and figuring out why took pulling apart snowpack data, valley temperatures, upper-atmosphere pressure patterns, and two decades of ENSO history.
Let’s take a look at what actually happened and what it might mean for this winter.
Comparing the two seasons
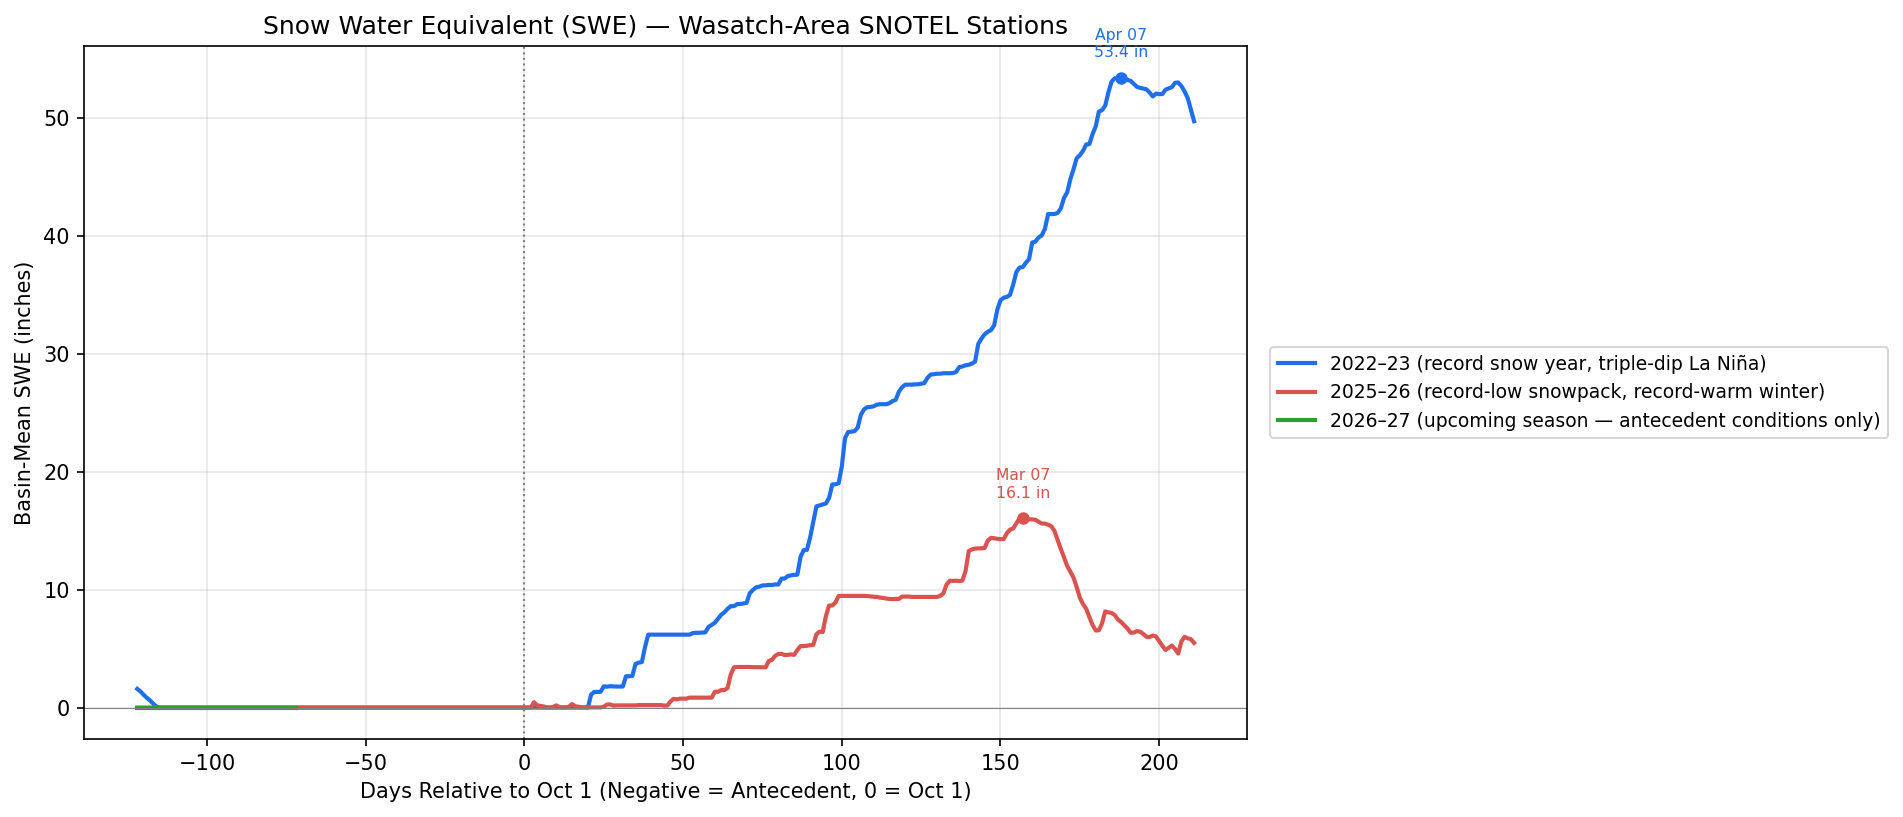
Figure 1: SWE daily totals for the 2022-2023 (blue) and 2025-2026 (red) ski seasons with this year’s SWE in green.
Before getting into causes of two wildly different ski seasons notice in the figure above how wildly different the cumulative snow-water equivalent values were between the two seasons. You can consider Figure 1 a representation of snowpack throughout the season.
Through late December, 2022-23 (blue) and 2025-26 (red) tracked almost identically, but each storm seemed to bring more snowfall in 2022-2023 from the start. Between day 50 (relative to October 1) and day 100, snow water equivalent rates were similar day to day. Then the lines split wildly where rates rapidly increase around day 100 in 2022-2023 while rates plateau during the same timeframe in the 2025-2026 ski season. The 2022-23 ski season climbed to a peak basin-mean SWE of 53 inches on April 7th while 2025-26 topped out at just 16 inches on March 7th — despite starting the season on the same path.
Both years peaked within 30 days of each other on the calendar, indicating a much shorter ski season for the 2025-2025 ski season. Despite SWE rates being roughly equal at the start, the 2025-2026 ski season didn’t amount to much. So what really happened?
It Wasn't the Storms
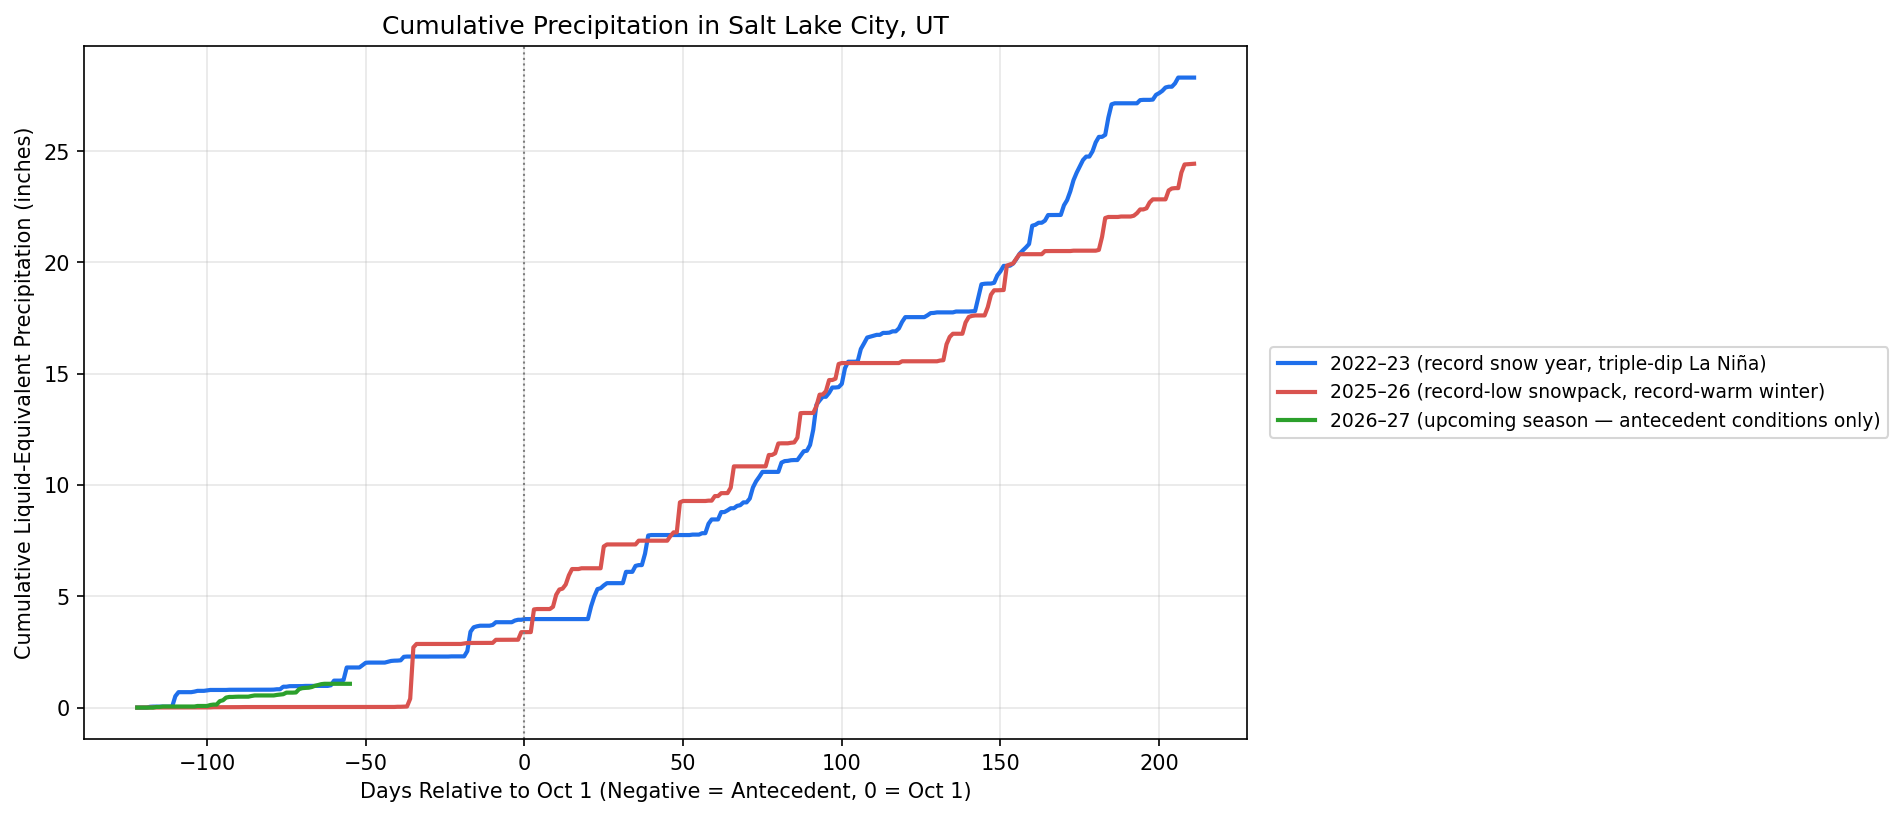
Figure 2 : Cumulative precipitation in the Salt Lake Valley over time for the 2022-2023 (blue) and 2025-2026 (red) ski seasons with this year’s precipitation in green.
Figure 2 provides the results that surprised me the most. The cumulative precipitation for both seasons in the Salt Lake Valley were very similar. Not identical — but close enough to argue against "it just didn't storm as much."
Of note, the precipitation trend for this year follows the 2023 ski season more closely than the 2026 ski season, which is exciting to see! But there are still a few weeks left in monsoon season, so the trends could change.
2022-23 saw about 28 inches of cumulative liquid-equivalent precipitation in Salt Lake City through the season. 2025-26 saw about 24 inches. That's a small gap for such a large gap in snowpack. What this figure says to me is that the the moisture was there. What caused the snowpack to be so different?
What we find is that the 2025-26 season wasn't a dry year. It just wasn't a cold year.
It was the temerature
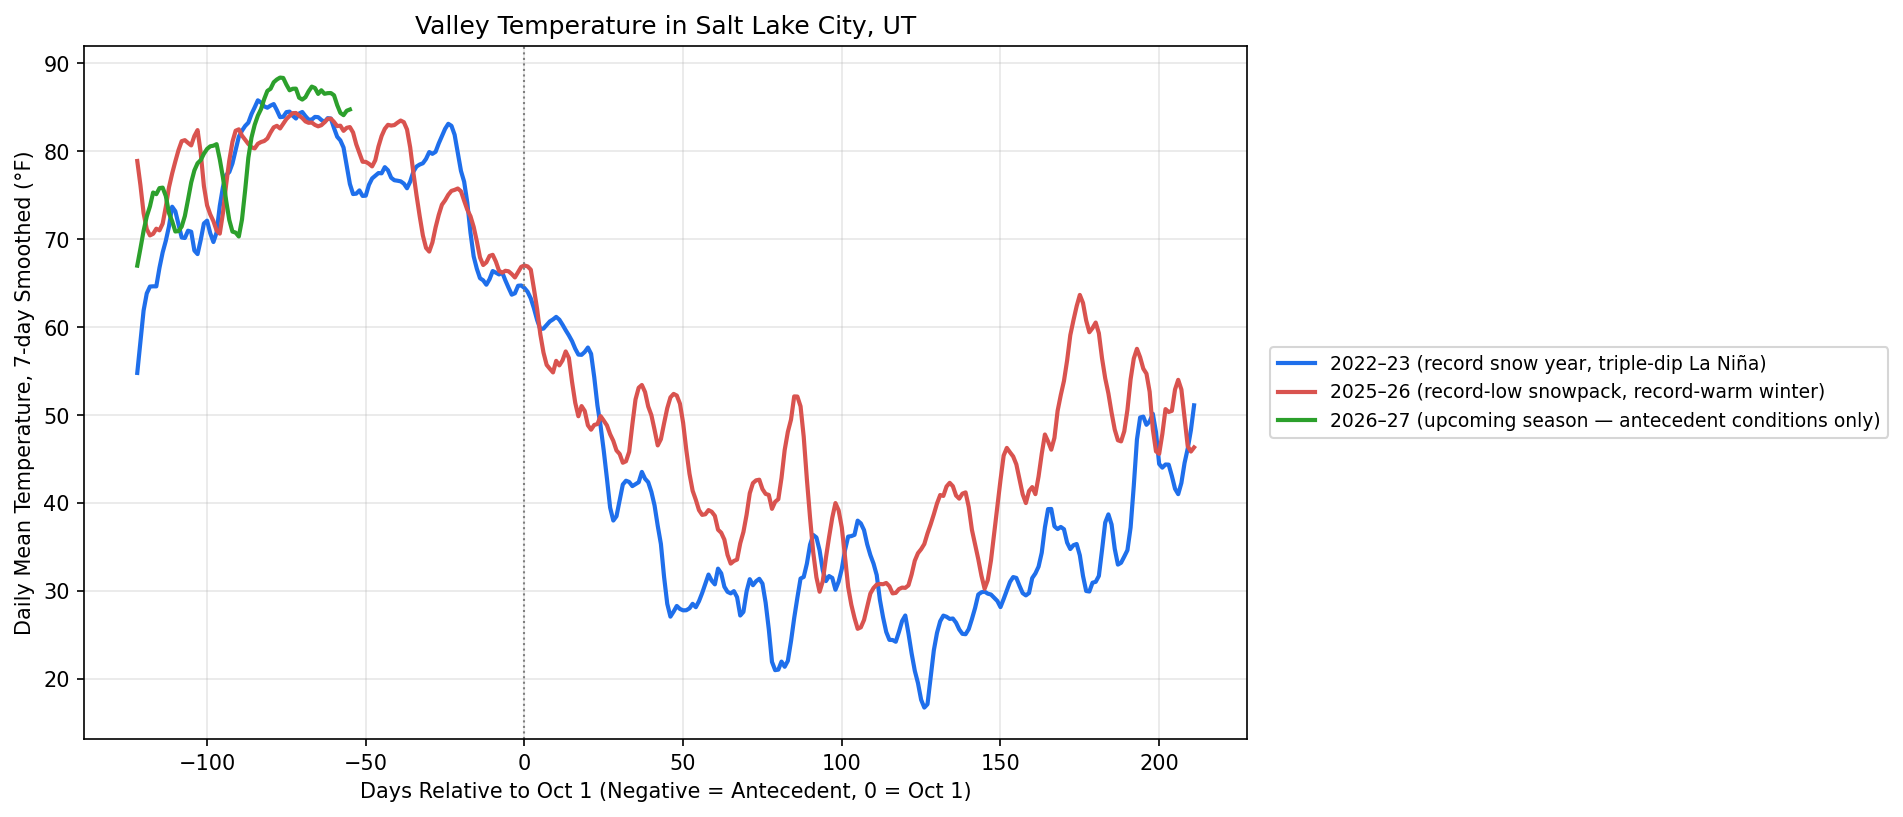
Figure 3: Temperature in the Salt Lake Valley over time for the 2022-2023 (blue) and 2025-2026 (red) ski seasons with this year’s temperature in green.
We learned that the storms were there during both seasons but amounted to very different snowpack totals. The difference, according the the data, is largely because of warm temperatures. The figure above paints the picture rather plainly. The red line (2025-2026 ski season) is consistently above the blue line (2022-2023 ski season) for a majority of the ski season.
I know what you’re thinking— Salt Lake Valley isn’t a good representation of what is happening in the mountains. You’re right, it’s not perfect, but it gives us a good idea of what is happening nearby. Analyzing temperature throughout the upper atmosphere, however, might give us a better idea as to what is going on in the high altitude regions.
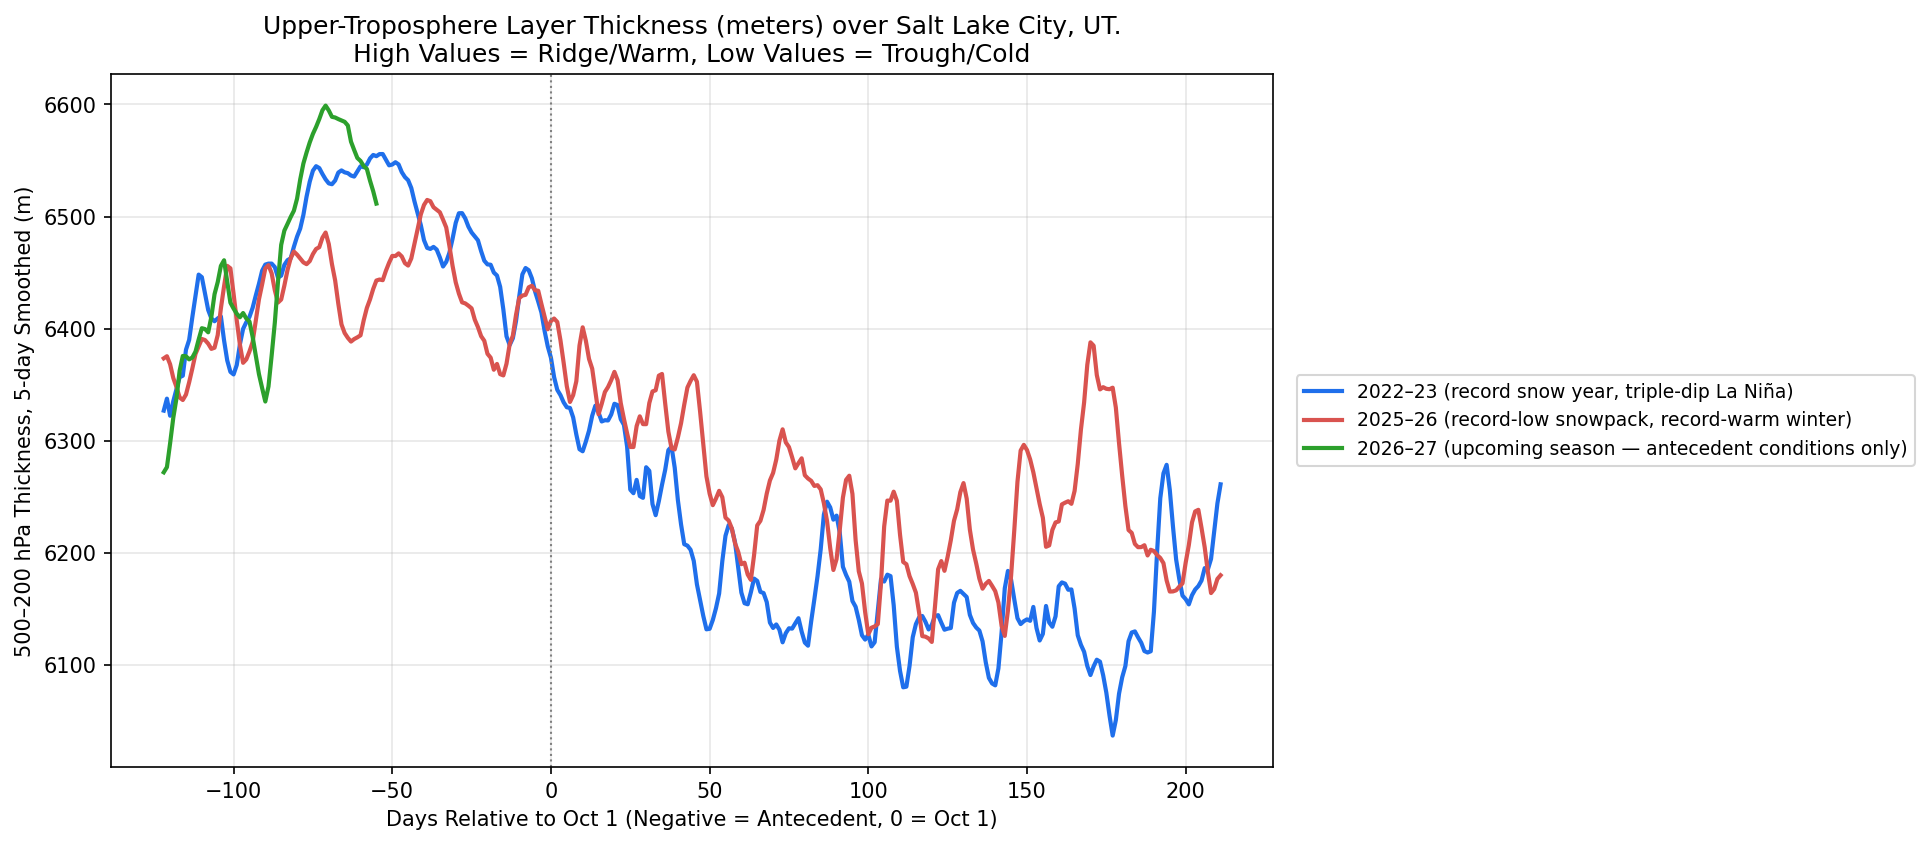
Figure 4: Air column thickness in the Salt Lake Valley over time for the 2022-2023 (blue) and 2025-2026 (red) ski seasons with this year’s thickness in green.
The 500-200 hPa thickness chart is a way of measuring how warm or cold a column of air is above a certain region. For this research, I looked at the column of air above Salt Lake City. Analyzing the 500-200 hPa thickness helps us understand the temperature of air throughout the atmosphere and not just at the surface. This difference matters greatly since we are talking about a roughly 5000 foot difference between Salt Lake City and the top of Snowbird. A greater thickness values means a warmer, more expanded air column. A Lower thickness value means colder, denser air. Through the core of the season, 2025-26 consistently ran higher than 2022-23.
Based on these data points, temperature is the main mechanism that created such wildly different season. A warmer atmospheric column pushes the rain-snow line up in elevation. The same storm that would've buried the mountains in powder in a cold year instead drops rain at lower elevations and wetter, denser snow up high. The precipitation gauge doesn't care. The snowpack does.
This is the finding that matters most for anyone trying to predict a ski season from precipitation forecasts alone: precipitation totals tell you if storms are coming. They don't tell you what falls out of them.
What about EL Niño and La NIña?
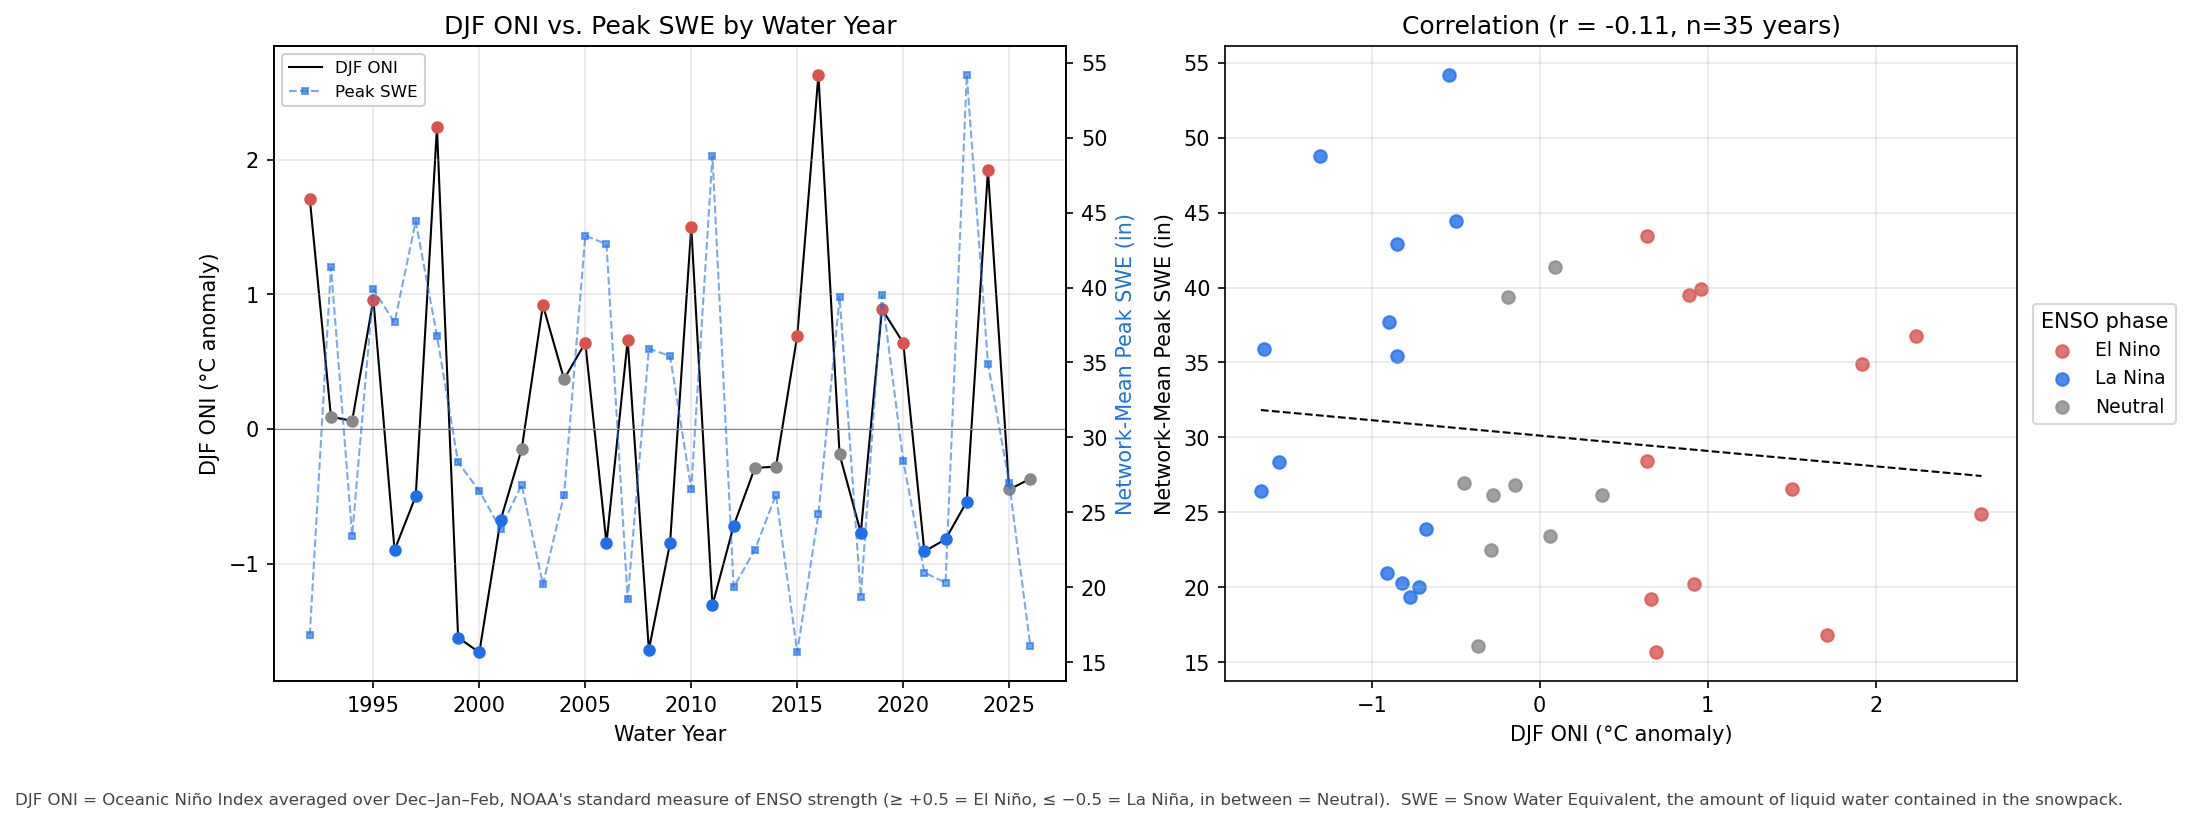
Figure 5: The left figure shows the ENSO index (solid black lines; red dots indicating El Nino year, blue dots indicating La Nina year) over time compared to the total SWE (blue dotted line) for each year. The right figure demonstrates the correlation between the ENSO phase and total SWE.
This is where the ENSO story falls apart (kind of), at least for Utah.
The chart above plots the DJF Oceanic Niño Index — NOAA's standard measure of El Niño/La Niña strength — against peak snow water equivalent across [N] years of Wasatch SNOTEL history. If ENSO cleanly predicted Utah snowpack, you'd expect a strong pattern: El Niño years clustering low, La Niña years clustering high, or vice versa.
That's not really what shows up. The correlation is weak — r = -0.11.
Utah sits almost exactly on the boundary between the wetter Pacific Northwest La Niña signal and the drier Southwest El Niño signal. Utah might just be too close to the seam for ENSO to say much on its own.
The long answer is: I don't have enough Utah-specific analog years (yet) to know for sure whether that neutral-years pattern is real or noise. This is a first pass at identifying whether a signal exists at all — not a final word on it.
So What About This Year?
Both 2022-23 and 2025-26 started in La Niña. This year, NOAA's Climate Prediction Center has a "super" El Niño developing, which is a completely different pattern that what we looked at in during either ski season. Therefore, it’s tough to compare this year 2023 or 2026.
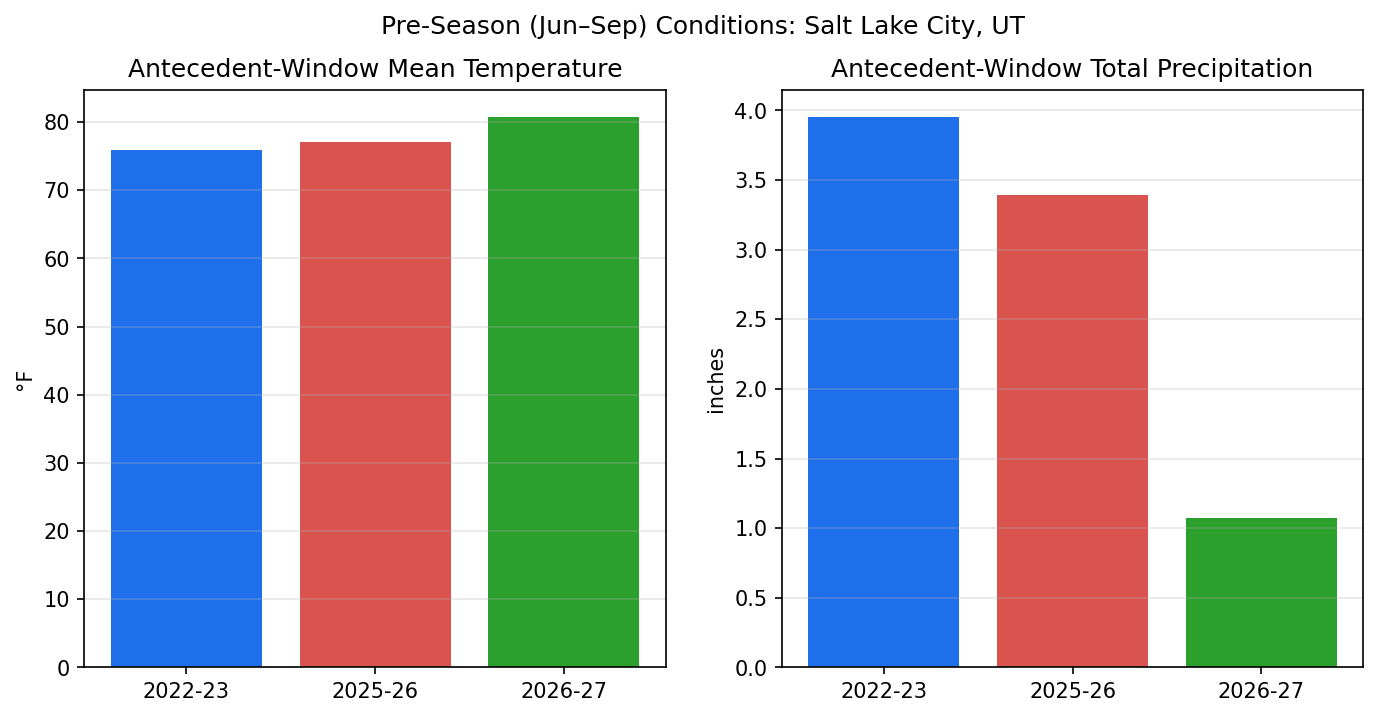
Figure 6: Pre season temperature averages and precipitation totals ahead of each ski season year.
This summer is on track to be the warmest of all years in this study. Precipitation was higher ahead of the 2022-2023 ski season in comparison to the 2025-2026 ski season but I fear we don’t have enough data to paint the full picture for this year. There has been noticeablly more storms which is keeping me hopeful!
Based on the data I pulled, here's the honest read: antecedent conditions can hint at soil moisture and storm-track setup, but they can't tell you what the temperature will do once the season starts — and that's the variable that seemed to decide the last two years. A strong El Niño adds another layer of uncertainty on top of that, not less
The Takeaway
Two seasons, same mountains, nearly the same amount of moisture falling from the sky. One year produced record highs while the other produced record lows. Based on this analysis, the difference wasn't the storms— it was the temperature.
ENSO doesn't look like a reliable predictor here, at least not on its own. Instead of comparing ENSO to SWE, I’ll compare it to temperature. Maybe ENSO has a more direct role on the temperatures we experience here in Utah.
The results of this project honestly surprised me! I was expecting to see a huge difference in precipitation levels, but really most of it just fell as rain. While I do love skiing in the rain, I’m looking forward to hopefully a more exciting ski season. Part 2 of this series digs into what Super El Niño years have historically meant for snowfall across the Western and Eastern US, so stay tuned.
None of this is a forecast for 2026-27, by the way. It's a diagnosis of what happened for the two record breaking ski seasons, given the datasets I used. How do you think this year’s ski season will turn out?
