Wildfires Have Become the Face of Climate Change. But What Does the Data Say?
When people think about climate change, wildfires are usually one of the first things that come to mind. We've all seen the orange skies, neighborhoods being evacuated, and forests burning across the western U.S.
While monitoring wildfires on MyRadar here in Utah, I noticed many of the recent fires were initially labeled as human-caused. I know those ignition sources can change as investigations continue, but it got me thinking:
How many wildfires are actually started by people versus natural causes? How have wildfires responded to increasing global temperatures? And what role does wildfire management funding play in this story?
During my Master's in Meteorology, I learned from a wildfire expert that connecting wildfires directly to climate change is much more complicated than it first appears. Wildfire behavior is influenced by ignition source, fuel availability, weather conditions, forest management, and where people build homes.
These are exactly the kinds of climate questions I find myself asking, so I built a small data pipeline to dig into decades of wildfire records, climate data, and suppression costs.
Let’s learn together.
First, I wanted to know: who or what actually starts wildfires?
One statistic surprised me more than anything else in this project. About 87% of U.S. wildfires are started by people — everything from unattended campfires to equipment sparks and debris burns — not lightning.
That number came from analyzing 24 years of official wildfire records (2001–2024), and it closely matches results from previous peer-reviewed research. Whenever two independent datasets tell the same story, it gives me a lot more confidence that I’m looking at something real. But here's where it gets interesting. Even though people start nearly nine out of every ten fires, those fires account for only 43% of the total area burned.
Lightning starts far fewer fires, but because they often ignite in remote forests under dry conditions, they burn much larger areas.
That distinction became one of the biggest themes throughout this project: The factors that determine whether a fire starts are not always the same factors that determine how large it becomes.
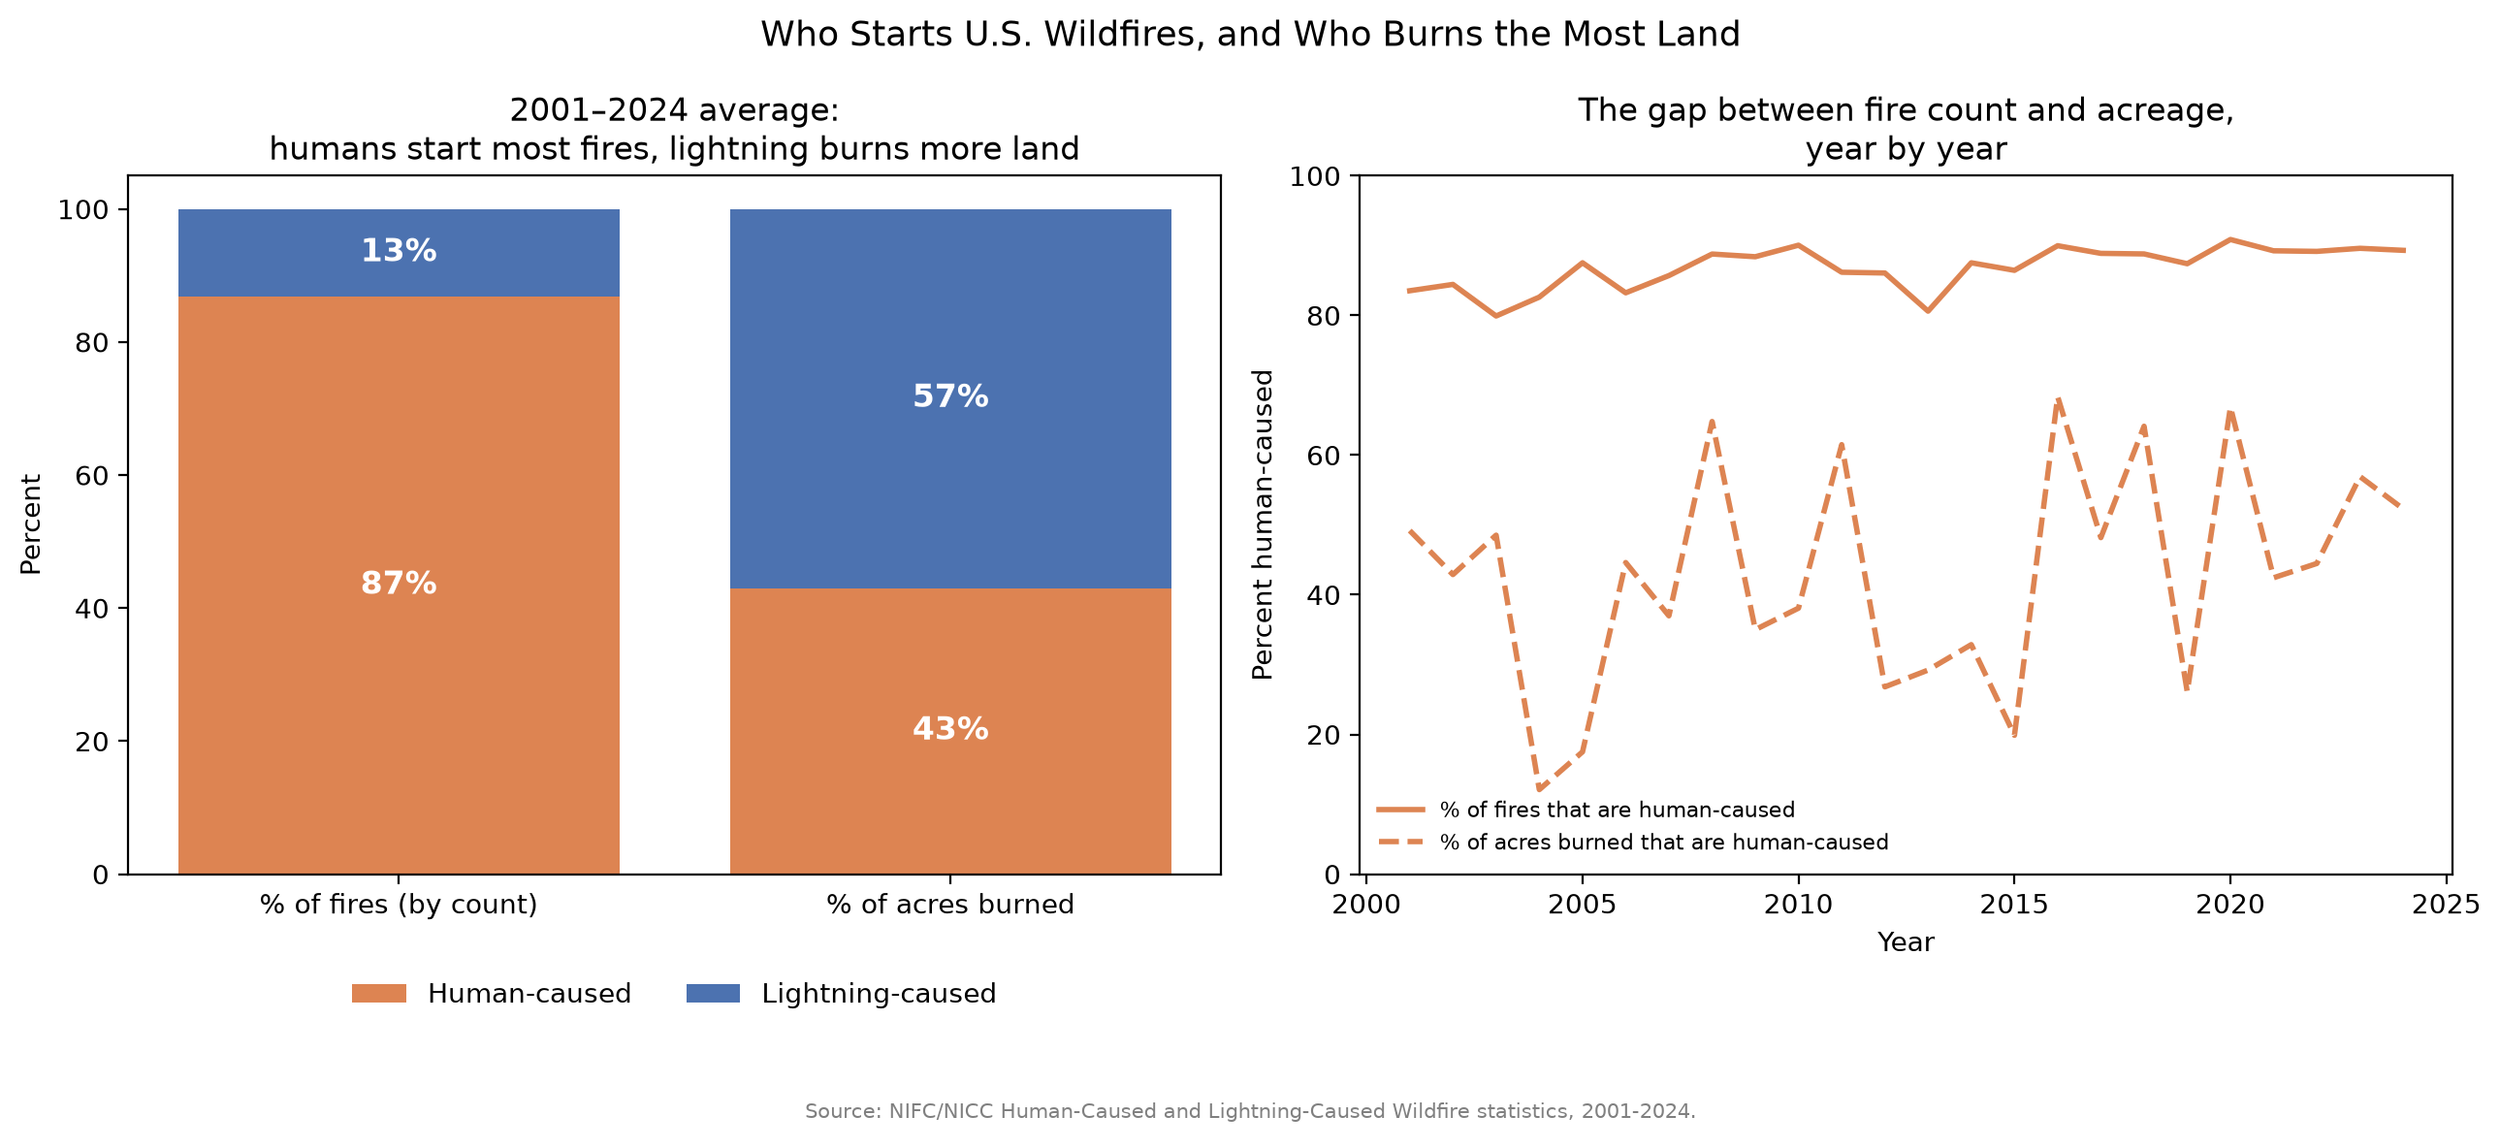
FIGURE 1: Human vs. Lightning Wildfire Causes. Left: Human-caused vs. lightning-caused percentage of fires and acreage burned. Right: Year-by-year trends from 2001–2024.
The figure above highlights one of the most surprising results from this project. Although humans start 87% of wildfires, those fires account for only 43% of the total acreage burned. Lightning starts just 13% of fires but is responsible for 57% of the acreage burned.
In other words, humans are responsible for most wildfire ignitions, but lightning-started fires tend to become much larger.
Fewer fires, way more acreage — but is that climate driven?
I pulled 42 years of official wildfire data (1983–2024) and ran a trend test instead of just eyeballing a chart. The number of fires per year shows no statistically significant trend (p = 0.82). Acres burned per year, however, shows a statistically significant upward trend (p < 0.0001). So the story is not simply "more fires every year."
Instead, the data suggests: Fewer fires, but larger fires.
That pattern is at least consistent with climate influencing fire behavior rather than fire frequency. In the figure below, notice that the number of wildfires per year is trending relatively flat, while acres burned trending upward.
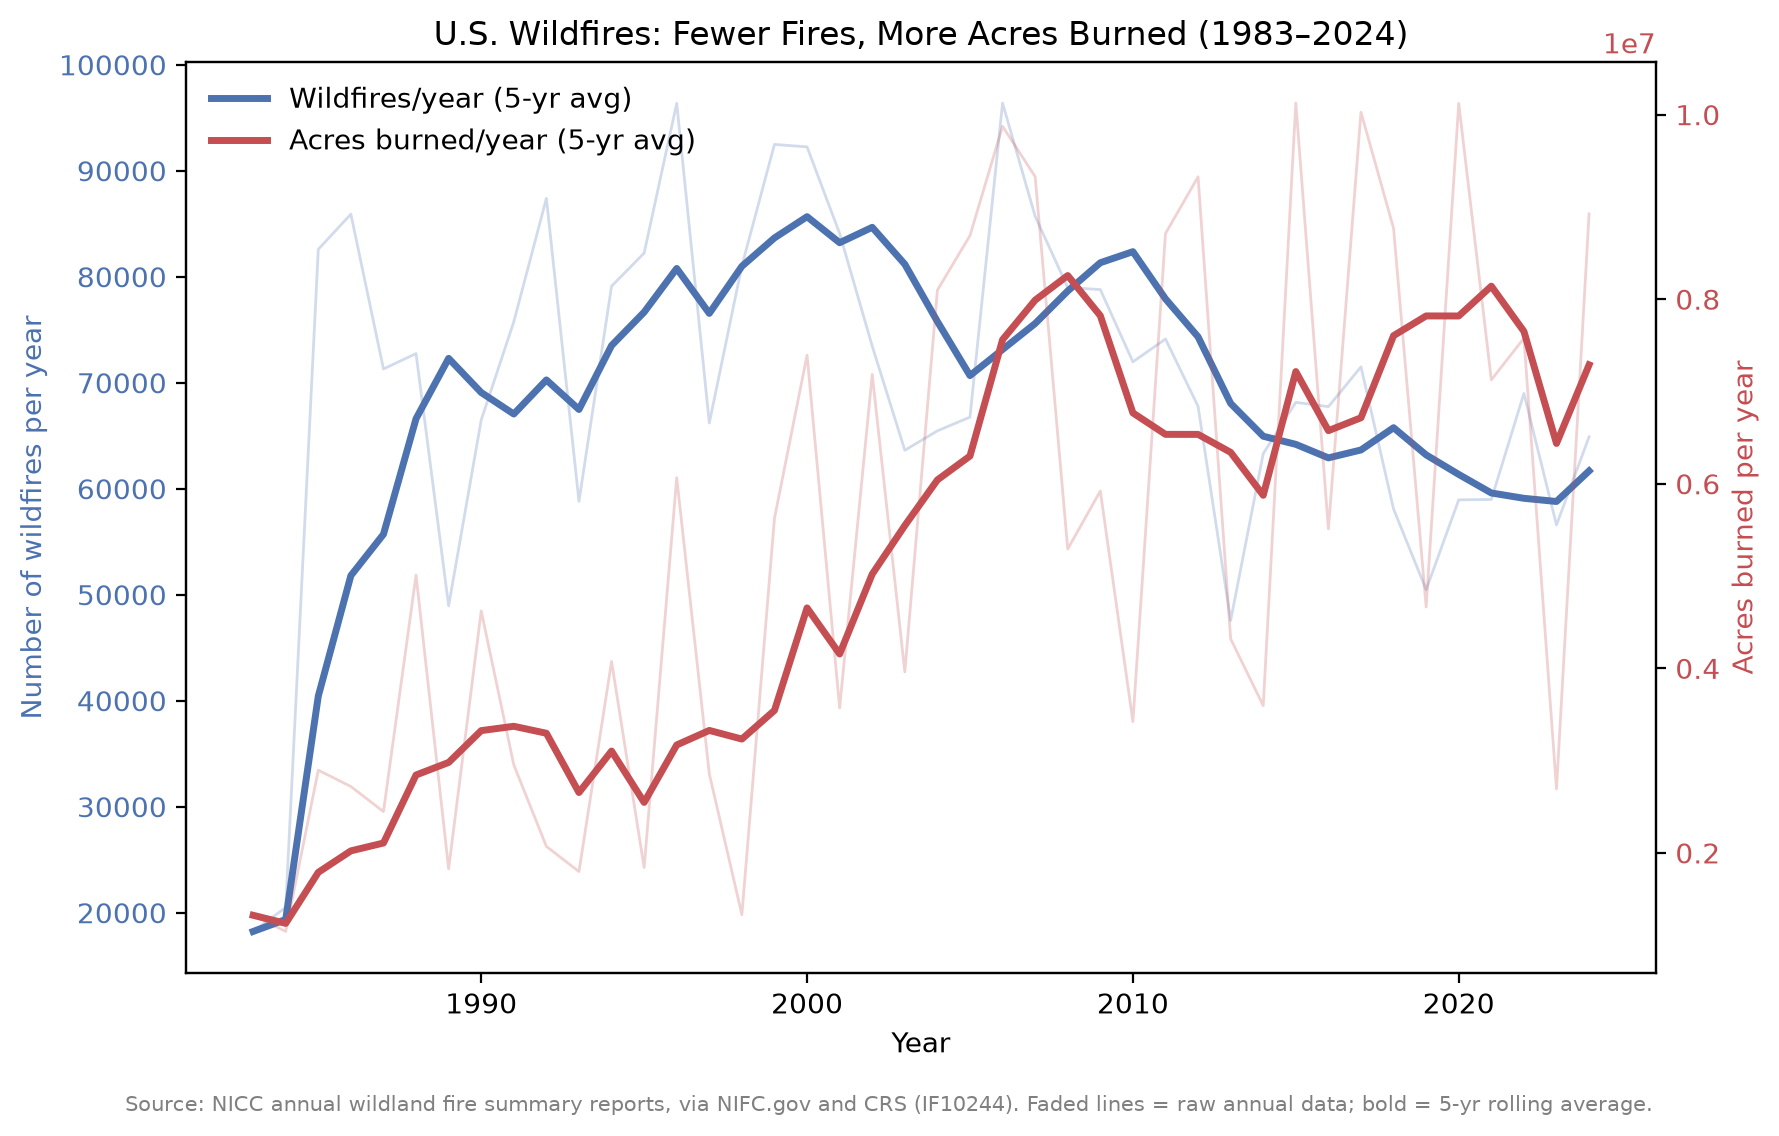
FIGURE 2: Wildfire Count vs. Acres Burned. Dual-axis line chart showing: wildfire count vs. acres burned. The bold lines reflect the 5-year rolling averages from 1983–2024 and faded lines represent the raw data.
Let’s pull in global temperature
I compared global mean temperature anomaly against annual U.S. acres burned.
At first glance, the relationship looked convincing. The correlation was strong: r = 0.56, p = 0.0001. Seems perfect, right?
Let’s put our skeptical statistician hat on.
Both datasets increased over the last 40 years. When two variables both trend upward over time, they can appear correlated even if one is not directly causing the other. It is the same reason ice cream sales correlate with drowning deaths. Neither causes the other. Summer causes both.
So I ran the more rigorous version: comparing the year-to-year changes in each dataset. This removes the shared long-term trend and asks a more useful question: In years when temperatures increased more than usual, did wildfire acreage also increase more than usual? The result: r = -0.17 and p = 0.30.The relationship was not statistically significant.
This does not mean climate change has no effect on wildfires. Instead, it suggests that global average temperature is simply too broad of a dataset to explain U.S. wildfire behavior.
Wildfires respond to regional conditions like: drought, fuel moisture, vapor pressure deficit, relative humidity, and forest health.
Published research estimates that human-caused climate change accounts for roughly 55% of the increase in fuel aridity across western U.S. forests since the 1970s.
That is a real, physical climate signal.
It is just not something we can capture with a simple "global temperature vs. total acres burned" comparison.
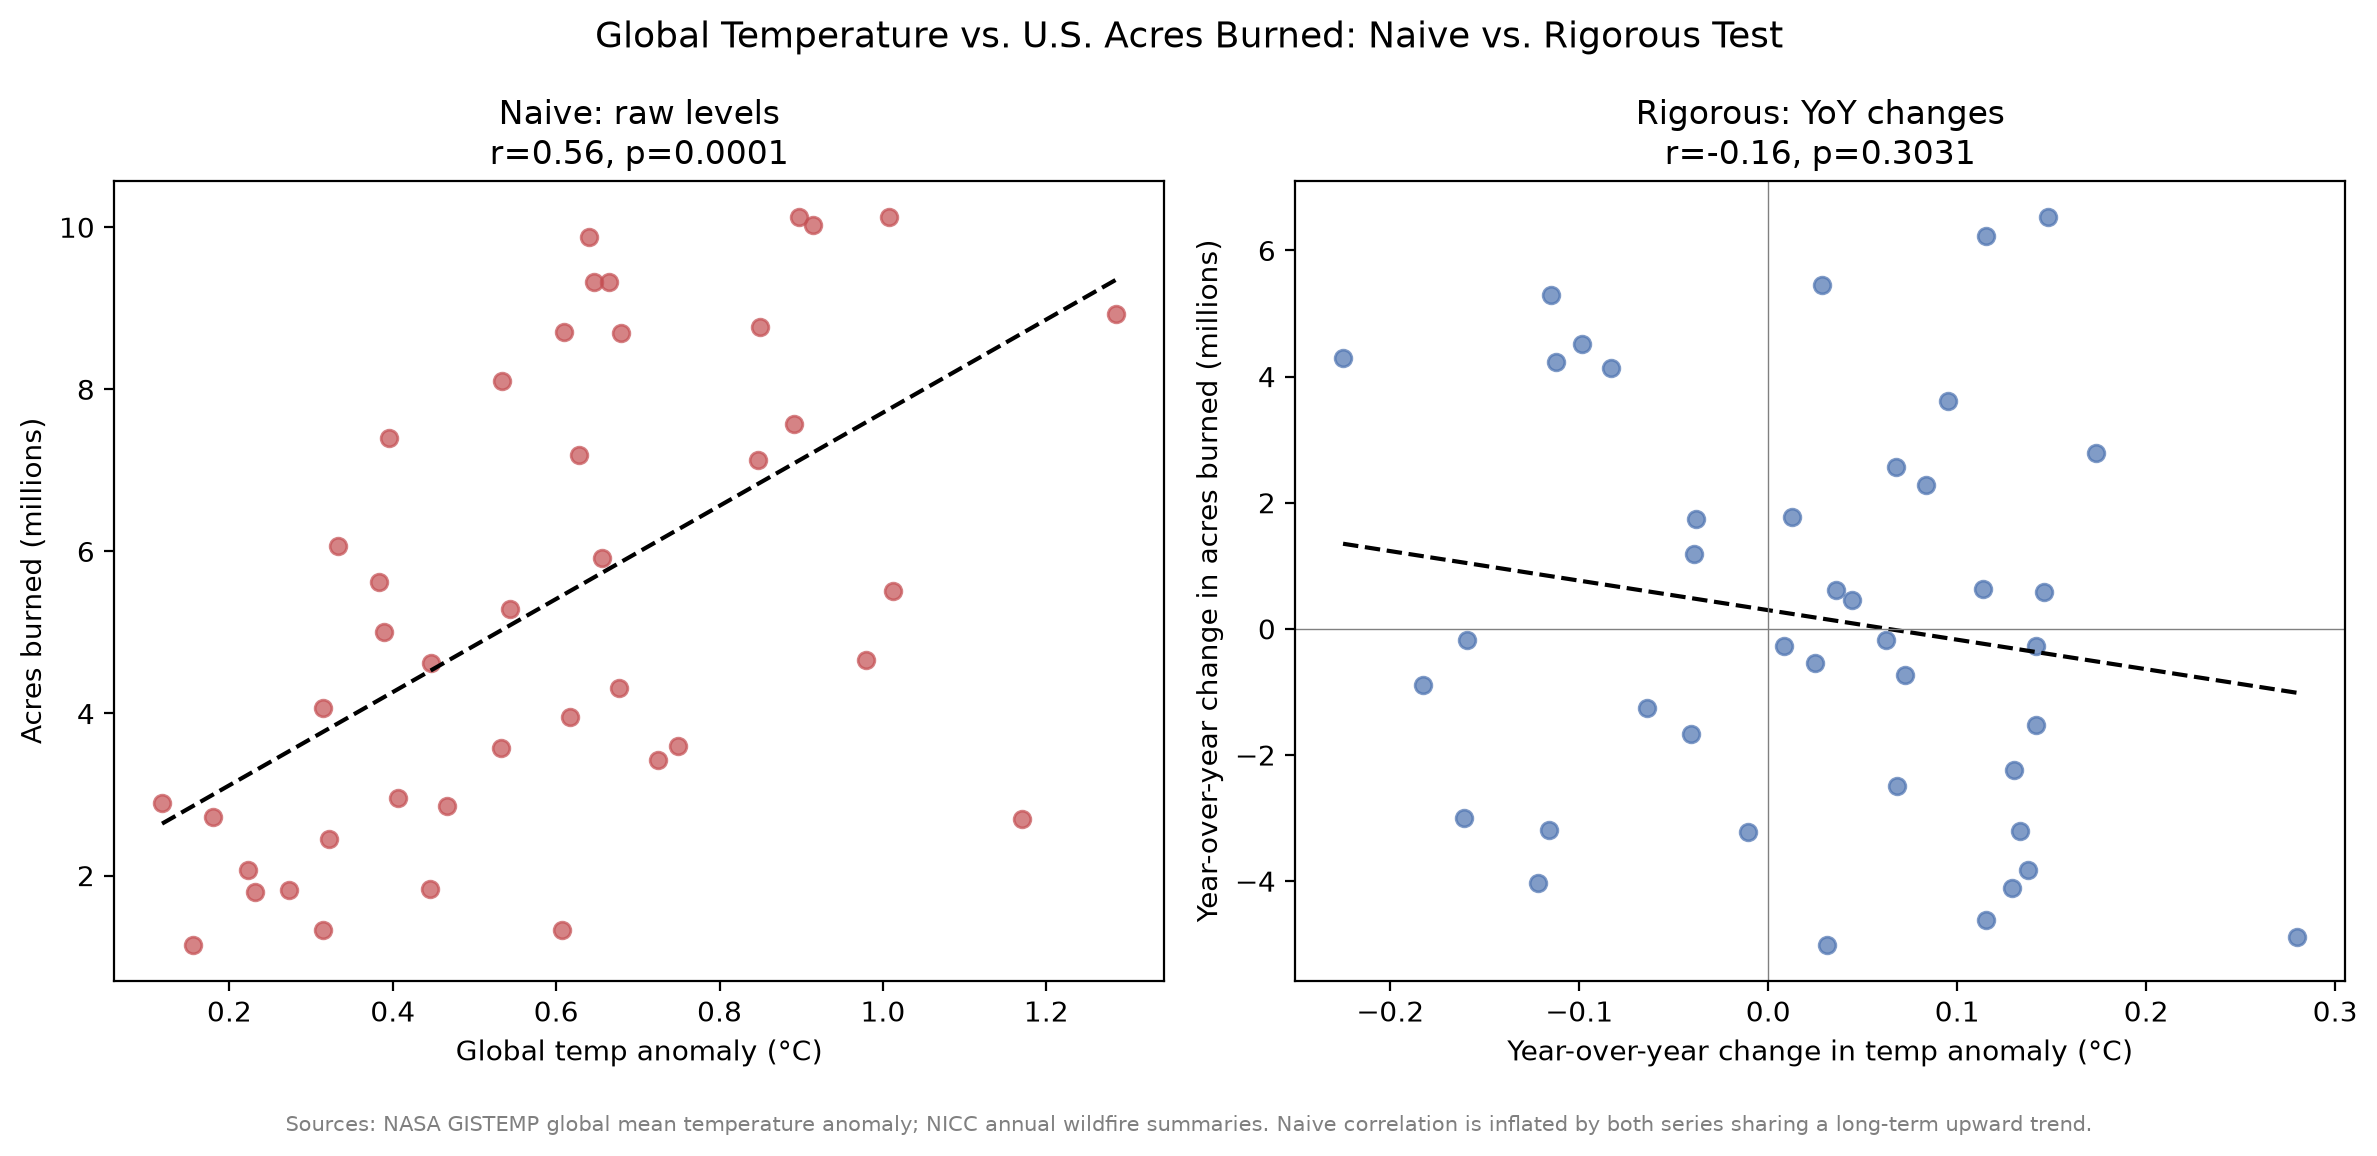
FIGURE 3: Naive vs. Rigorous Climate Correlation. Left: raw temperature vs. acreage correlation. Right: relationship after removing the shared trend.
How much money is there in wildfires?
I wanted to understand how wildfire management funding changed over time to see if it had any impact on the number of wildfires or acreage burned. I pulled 38 years of federal wildfire suppression costs and adjusted for inflation.
The results surprised me. Nominal suppression costs increased about 15 times. After adjusting for inflation, costs increased closer to 5 times. That means a significant portion of the "wildfire costs exploded" narrative is explained by inflation.
However, real cost per acre burned still increased from about $340 to $460 (in 2022 dollars). That means fires have actually become more expensive to fight per acre, independent of inflation and total acreage burned.
One possible explanation is the increasing development of the wildland-urban interface where more communities are being built near areas where wildfires naturally occur.
Meanwhile, fuel-treatment funding — money spent thinning forests and conducting prescribed burns before fire season — was much harder to analyze.
Agency reporting was inconsistent, making it difficult to compare trends over time. The available Department of Interior data (2018–2024) shows treated acres increasing by 86%, largely driven by a specific infrastructure investment rather than a long-term shift in forest conditions.
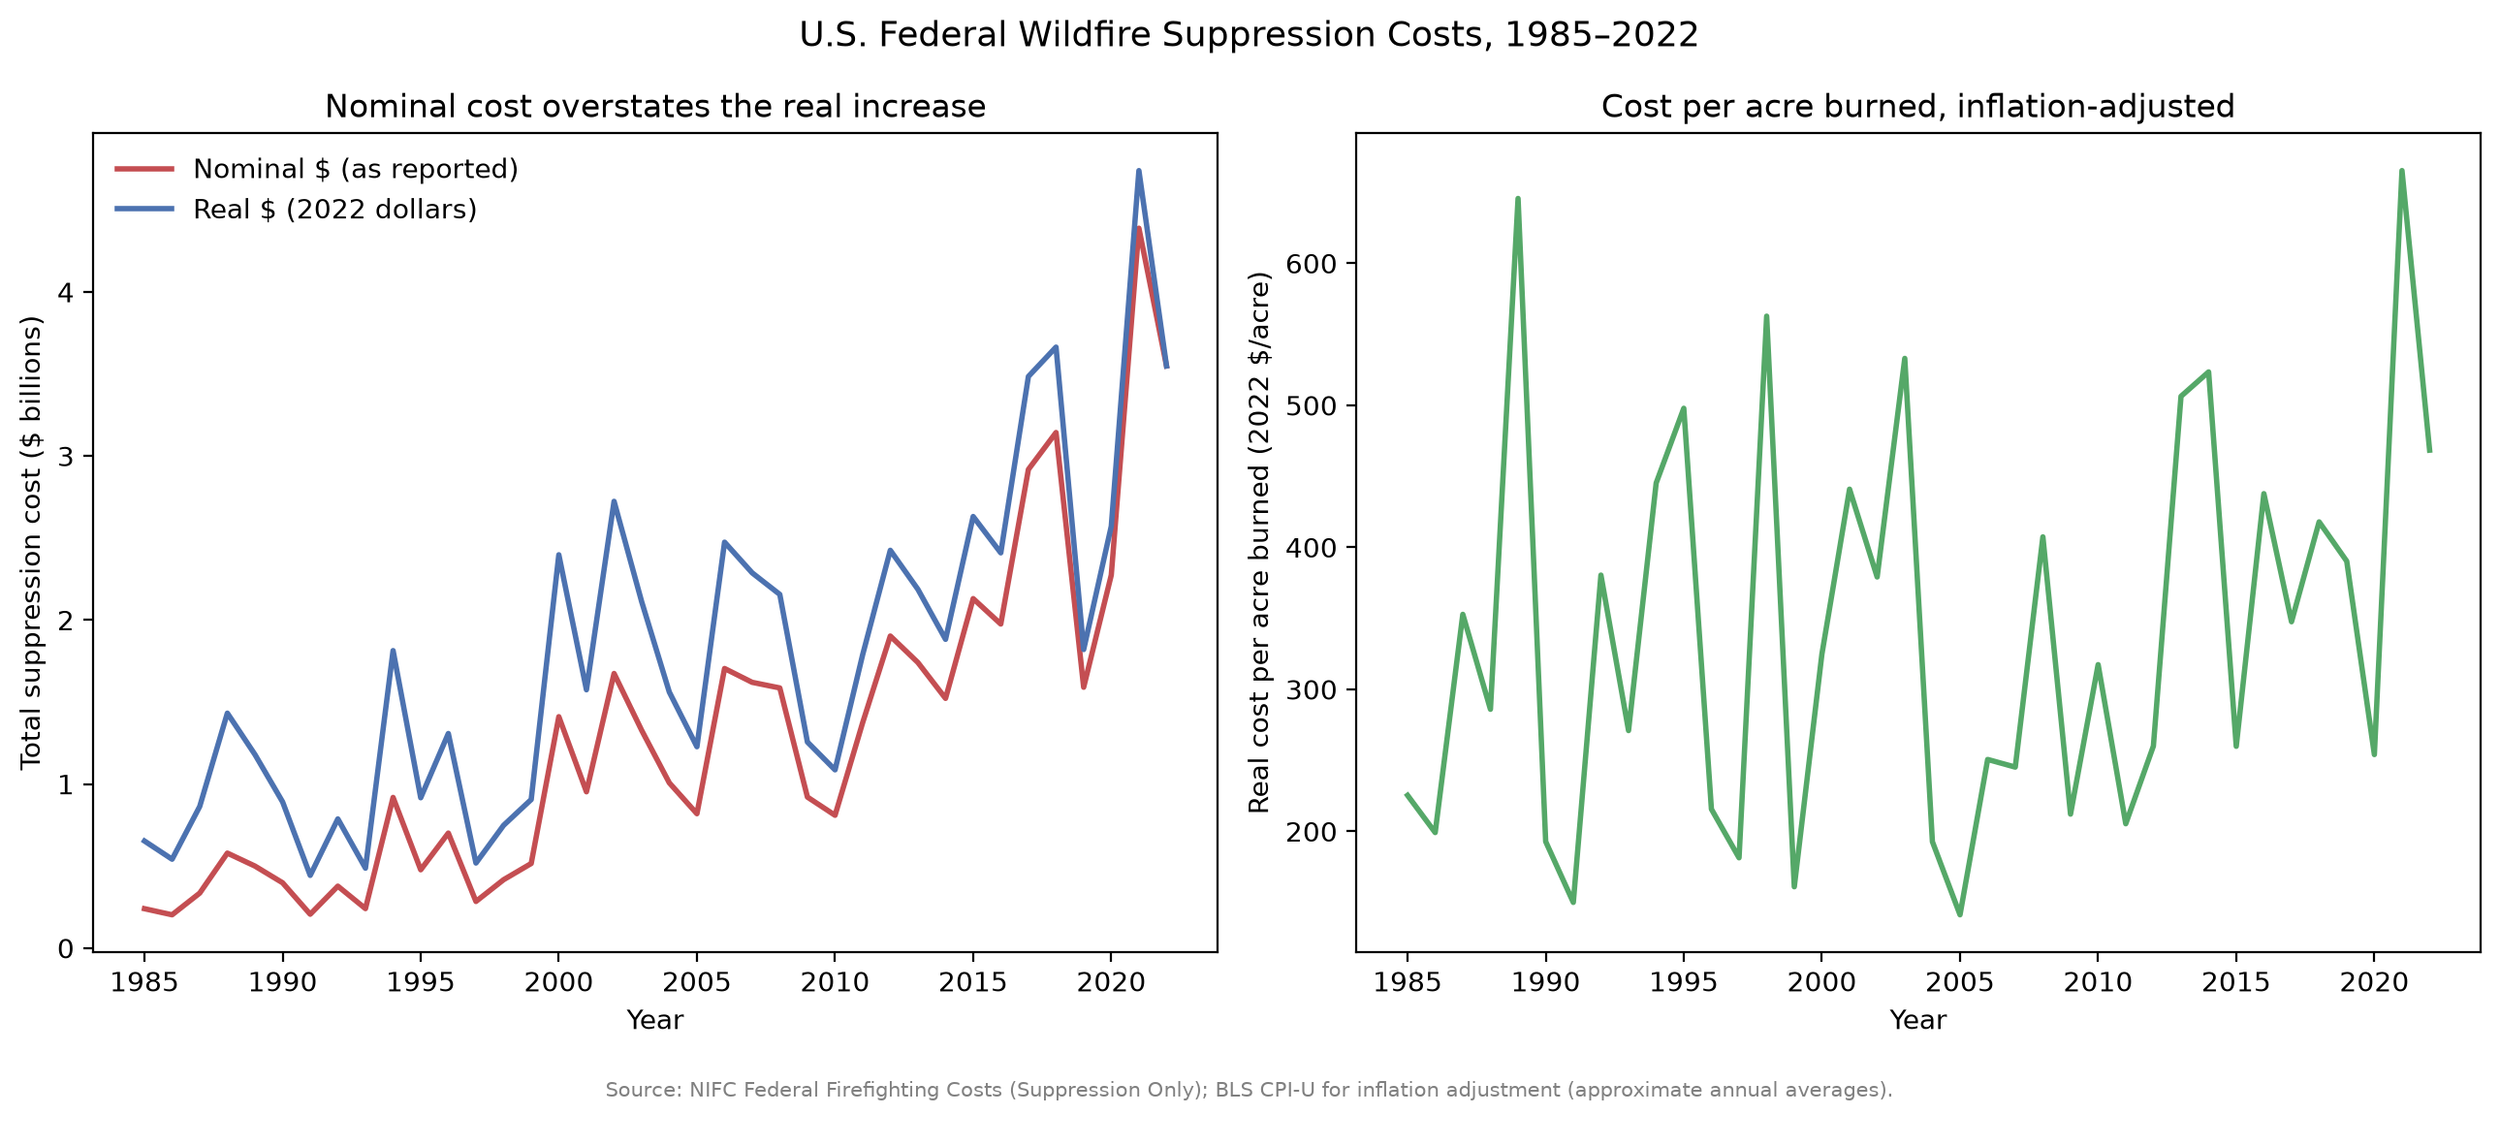
INSERT FIGURE 4: Wildfire Suppression Costs. Left: nominal vs. inflation-adjusted suppression costs. Right: inflation-adjusted cost per acre burned.
Final thoughts
One thing I found interesting is that global average temperature correlated much more strongly with acreage burned than with the number of fires. I expected human-caused ignitions to play a role in wildfire trends, but I did not expect humans to account for 87% of wildfire ignitions.
I also found the wildfire management funding data frustrating. I hoped it would provide clearer answers about how fuel availability changes before fire season. My hypothesis was simple: Less investment in fuel management → more available fuel → larger wildfire potential. However, the available data was not consistent enough to answer that question. This is something I would like to explore further, and I am always open to dataset recommendations.
One thing this project reminded me is that wildfires are incredibly complicated. Climate change absolutely influences wildfire conditions, but it is only one piece of a much larger system that also includes ignition source, fuel availability, forest management, weather patterns, and where people choose to build homes. The biggest lesson I took away is that wildfire science does not fit neatly into a single headline. Climate change is here, and it is influencing how severe fires can become once they start.
The better question is:
How will climate change influence the conditions that create extreme wildfire behavior in the future? Understanding changes in drought, temperature, humidity, wind patterns, and fuel conditions will paint a much clearer picture of how climate change affects wildfire risk.
What’s next?
From these results, I would like to explore the relationship between lightning and wildfires further. My hypothesis is that lightning burns more acreage because lightning-caused fires are more likely to start in remote areas with fewer resources available for early suppression.
I also did not analyze wind-driven wildfires, which I think would be an interesting addition to a future study.
Another logical next step would be modeling how future climate conditions influence drought, relative humidity, wind, fuel moisture, and temperature — the weather and climate variables that actually determine wildfire behavior.
Thanks for joining me! Let me know if you have any dataset recommendations or ideas I should explore next! :)
Data
NICC annual wildfire summaries (1983–2024), NIFC suppression costs (1985–2022), BLS CPI-U, NASA GISTEMP global temperature anomaly (1983–2024), NIFC human-caused/lightning-caused wildfire statistics (2001–2024).
